1. Introduction
1.1 About
BioCircos.js is an open source interactive Javascript library which provides an easy way to interactive display biological data on the web. It implements a raster-based SVG visualization using the open source Javascript framework jquery.js. BioCircos.js is multiplatform and works in all major internet browsers (Internet Explorer, Mozilla Firefox, Google Chrome, Safari, Opera). Its speed is determined by the client’s hardware and internet browser. For smoothest user experience, we recommend Google Chrome.
BioCircos.js provides SNP, CNV, HEATMAP, LINK, LINE, SCATTER, ARC, TEXT, and HISTGRAM modules to display genome-wide genetic variations (SNPs, CNVs and chromosome rearrangement), gene expression and biomolecule interactions. BioCircos.js also provides BACKGROUND module to display background and axis circles. Tooltips showing detailed information of SVG elements are also provided.
Note
BioCircos.js itself is not a web application, but a JavaScript library that provides the functionality for bioinformatians to build Circos-like figure on bioinformatians’ own web applications. The BioCircos.js users are supposed to be familiar with HTML, CSS and JavaScript.
1.2 BioCircos.js & Circos
Though BioCircos.js shares its name with Circos, BioCircos.js is not exactly the same as Circos desktop. BioCircos.js is a JavaScript library for programmers. It is not an app for end-users, and developers need to write code around BioCircos.js to build graphcentric apps. The comparison between BioCircos.js and Circos is as follow:
| Comparison | BioCircos.js | Circos |
|---|---|---|
| Code | JavaScript | Perl |
| Users | For web developers / bioinformatians | For end-users |
| Interactive | Yes | No |
| Used to | Build Circos-like web applications / draw figures | Draw figures |
1.3 Funding
BioCircos.js was supported by grants from the National High Technology Research and Development Program (“863” Program) of China (2015AA020108 and 2014AA021502) and the National Natural Science Foundation of China (31520103905).
3. Getting started
Step0. View demos in locale
There is a very easy and quick way to experience the power of BioCircos.js. Do it step by step according to the following:
- Download and extract demos file biocircos_demos.
- Open index.html file in biocircos_demos folder with your locale browser. Yes, everything is done! You will see the following. Click on the links, and you can see all of our demos locally.
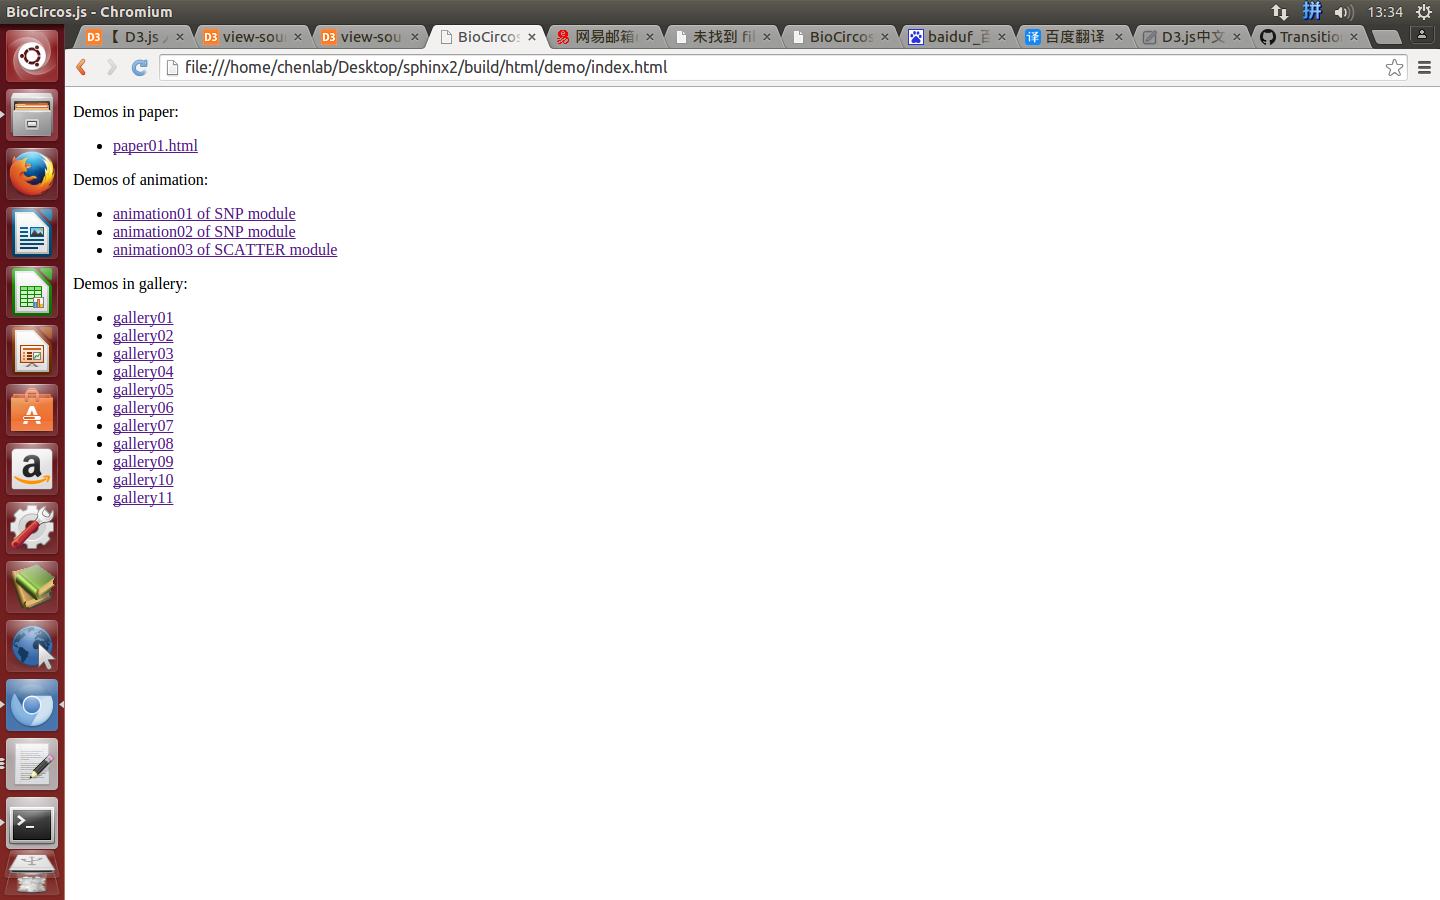
“biocircos_demos” contains three folders(“lib”, “pages”, “data”) and “index.html”. “lib” contains three JavaScript library files. “pages” contains configurations for demos. “data” contains the input data from users. The file structure of “biocircos_demos”:
---biocircos_demos
   ---lib
      ---biocircos-1.1.0.js
      ---d3.js
      ---jquery.js
   ---pages
      ---gallery01.html
      ---gallery02.html
      ......
   ---data
      ---Figure_ARC_DELETION.js
      ---Figure_SNP01.js
   ---index.html
Step1. Including BioCircos.js
This section will familiarise you with the basic steps necessary to start using BioCircos.js. Here we will visualize the GWAS data in GWAS Catalog with BioCircos.js step by step.
After Step0, you will have a “pages” folder in “biocircos_demos” folder. Now create a new file “gwas.html” in “pages” folder, then include BioCircos.js in a <script> tag. Now, “gwas.html” is as follows:
<!DOCTYPE html>
<html>
<head>
        <meta charset="utf-8">
        <title>BioCircos.js</title>
</head>
<body>
        <!-- BioCircos.js, Jquery.js and D3.js import -->
        <script src="../lib/jquery.js"></script>
        <script src="../lib/d3.js"></script>
        <script src="../lib/biocircos-1.1.0.js"></script>
</body>
</html>
Note
BioCircos.js is based on Jquery.js and D3.js, so they should be included before BioCircos.js. Jquery.js, D3.js and BioCircos.js can be found in the lib folder of biocircos_demos.tar.gz.
Step2. <div> tag to set picture position in html
After Step1, prepare a <div> tag with “biocircos” id to set the picture position you will draw in html. Now, “gwas.html” is as follows:
<!DOCTYPE html>
<html>
<head>
        <meta charset="utf-8">
        <title>BioCircos.js</title>
</head>
<body>
        <!-- BioCircos.js, Jquery.js and D3.js import -->
        <script src="../lib/jquery.js"></script>
        <script src="../lib/d3.js"></script>
        <script src="../lib/biocircos-1.1.0.js"></script>
        <!-- Prepare a <div> tag with "biocircos" id to set the picture position your will draw in html -->
        <div id="biocircos"></div>
</body>
</html>
Step3. Genome configuration
“Genome configuration” defines the number and size of chromosomes.
After Step2, We will configure “Genome configuration”. Genome configuration is set in a <script> tag. Here we configure the most used human genome - hg19, its data tag are defined as BioCircosGenome. Now, “gwas.html” is as follows:
<!DOCTYPE html>
<html>
    <head>
        <meta charset="utf-8">
        <title>BioCircos.js</title>
    </head>
    <body>
        <!-- BioCircos.js, Jquery.js and D3.js import -->
        <script src="../lib/jquery.js"></script>
        <script src="../lib/d3.js"></script>
        <script src="../lib/biocircos-1.1.0.js"></script>
        <!-- Prepare a <div> tag with "biocircos" id to set the picture position your will draw in html -->
        <div id="biocircos"></div>
<!-- Genome configuration -->
<script>
  var BioCircosGenome = [   // human hg19, data tag is BioCircosGenome
     ["1" , 249250621],
     ["2" , 243199373],
     ["3" , 198022430],
     ["4" , 191154276],
     ["5" , 180915260],
     ["6" , 171115067],
     ["7" , 159138663],
     ["8" , 146364022],
     ["9" , 141213431],
     ["10" , 135534747],
     ["11" , 135006516],
     ["12" , 133851895],
     ["13" , 115169878],
     ["14" , 107349540],
     ["15" , 102531392],
     ["16" , 90354753],
     ["17" , 81195210],
     ["18" , 78077248],
     ["19" , 59128983],
     ["20" , 63025520],
     ["21" , 48129895],
     ["22" , 51304566],
     ["X" , 155270560],
     ["Y" , 59373566]
  ];
</script>
    </body>
</html>
Note
Here we configure hg19 human genome with data tag as BioCircosGenome.
Step4. Initialisation and Main configuration
“Main configuration” is the main configuration file of BioCircos.js and mainly divided into four classes: “Customize SVG”, “Customize genome”, “Customize Events” and “Customize Tooltips”.
After Step3, We will initialize BioCircos.js and configure “Main configuration”. Here are three changes:
- Initialize BioCircos.js
All of the data tags that is defined in “Genome configuration” and “Data configuration” must be initialized here. We initialize data tag - BioCircosGenome as below:
BioCircos01 = new BioCircos(BioCircosGenome,{
Danger
All of the data tags that is defined in “Genome configuration” and “Data configuration” must be initialized here.
- Main configuration
Here we configure 6 attributes in “Main configuration”, other attributes are used their default values. More attributes can be found in “Main configuration” part of this document.
| Main configuration | Default value | Class | Description |
|---|---|---|---|
target |
“biocircos” | Customize SVG | SVG position in html, where <div> id is “biocircos” |
svgWidth |
900 | Customize SVG | SVG width |
svgHeight |
600 | Customize SVG | SVG height |
chrPad |
0.04 | Customize genome | distance between chromosomes |
innerRadius |
246 | Customize genome | inner radius of chromosome |
outerRadius |
270 | Customize genome | outer radius of chromosome |
- BioCircos.js callback
Callback is necessary, but it is usually the same, so don’t need to be too concerned about it.
Now, “gwas.html” is as follows:
<!DOCTYPE html>
<html>
<head>
<meta charset="utf-8">
<title>BioCircos.js</title>
</head>
<body>
<!-- BioCircos.js, Jquery.js and D3.js import -->
<script src="../lib/jquery.js"></script>
<script src="../lib/d3.js"></script>
<script src="../lib/biocircos-1.1.0.js"></script>
<!-- Prepare a <div> tag with "biocircos" id to set the picture position your will draw in html -->
<div id="biocircos"></div>
<!-- Genome configuration -->
<script>
var BioCircosGenome = [
["1" , 249250621],
["2" , 243199373],
["3" , 198022430],
["4" , 191154276],
["5" , 180915260],
["6" , 171115067],
["7" , 159138663],
["8" , 146364022],
["9" , 141213431],
["10" , 135534747],
["11" , 135006516],
["12" , 133851895],
["13" , 115169878],
["14" , 107349540],
["15" , 102531392],
["16" , 90354753],
["17" , 81195210],
["18" , 78077248],
["19" , 59128983],
["20" , 63025520],
["21" , 48129895],
["22" , 51304566],
["X" , 155270560],
["Y" , 59373566]
];
BioCircos01 = new BioCircos(BioCircosGenome,{ // Initialize BioCircos.js with "BioCircosGenome" and Main configuration
//Main configuration
target : "biocircos", // Main configuration "target"
svgWidth : 900, // Main configuration "svgWidth"
svgHeight : 600, // Main configuration "svgHeight"
chrPad : 0.04, // Main configuration "chrPad"
innerRadius: 246, // Main configuration "innerRadius"
outerRadius: 270, // Main configuration "outerRadius"
});
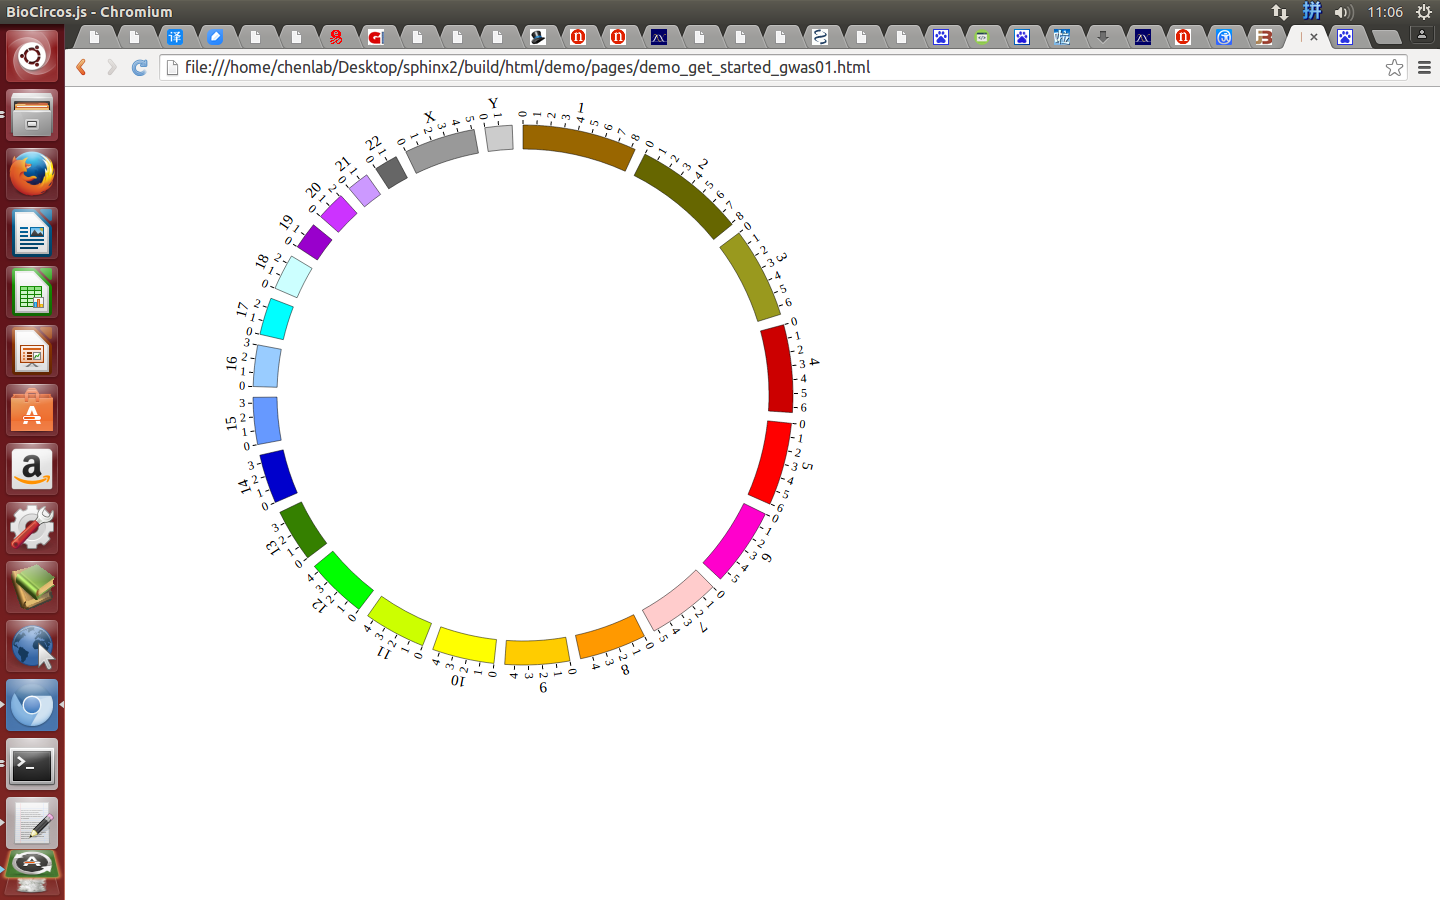
BioCircos01.draw_genome(BioCircos01.genomeLength); // BioCircos.js callback
</script>
</body>
</html>
Great! You have drawn a simple genome! Is it so easy? Open “gwas.html” file with your locale browser and view it as below:
Step5. Add Data configuration
“Data configuration” is designed for “Function Modules” in BioCircos.js. According to “Function Modules” division, “Data configuration” includes ten parts:
| Data Configuration Class | For Biological Data | Need “Data Preparation Tools” |
|---|---|---|
| SNP module | SNP with value; GWAS data... | Yes |
| SCATTER module | SNP without value; Genes data... | Yes |
| LINK module | Gene fusions; Interaction; SV... | Yes |
| CNV module | CNV with value... | Yes |
| ARC module | CNV without value; Gene domain; Chromosome band... | Yes |
| HEATMAP module | Gene expression... | Yes |
| HISTOGRAM module | Gene expression... | Yes |
| LINE module | Gene expression... | Yes |
| BACKGROUND module | Display background and axis circles | No |
| TEXT module | Assigning annotation text | No |
We have provided “Data Preparation Tools” to prepare the data for almost all “Function Modules” except “BACKGROUND” and “TEXT” module.
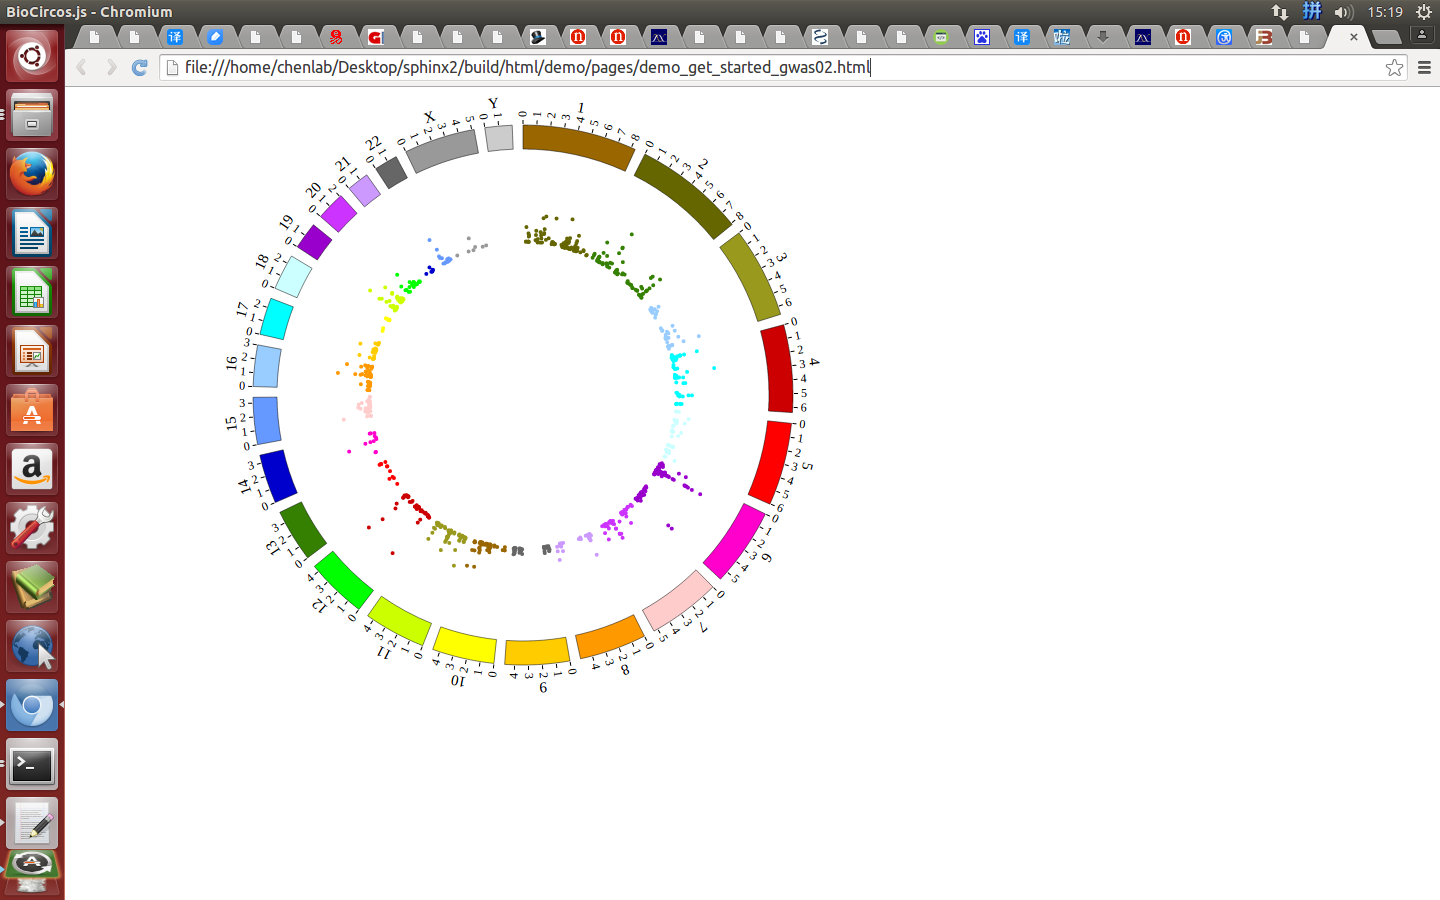
Step5.1 Display GWAS data using SNP module
- Input GWAS data
We download GWAS data from GWAS Catalog. Then we filtered the data and just left the items which their P-value less than 1E-18. We saved the data in SNP04_gwascatalog.txt, as below:
10      100315722       20.2218 rs603424
10      101219450       19      rs11190870
10      103086421       25.1549 rs11191548
10      112998590       74.0969 rs7903146
......
X       5266661 24.699  rs6638512
X       67343176        90.699  rs2497938
X       69578860        18.1549 rs11796357
X       79241621        32.699  rs5912838
- The first column is the name of the chromosome.
- The second column is the position of the SNP
- The third column is the value of -log10(P-value)
- The fourth column is the dbSNP id
- Use “Data Preparation Tools” to prepare data
Note
You need to install the python 2, before running Biocircos_PrepareData.py. You can skip this step, just download SNP04_gwascatalog.js for the next step.
We provide a python program Biocircos_PrepareData.py to help users prepare the input data for each module of BioCircos.js
python Biocircos_PrepareData.py SNP SNP04_gwascatalog.txt > SNP04_gwascatalog.js
Move SNP04_gwascatalog.js to ./biocircos_demos/data/get_started_gwas/ in your locale.
- Output GWAS data used in BioCircos.js
var SNP04_gwascatalog = [ "SNP04_gwascatalog" , {
  maxRadius: 205,
  minRadius: 153,
  SNPFillColor: "#9400D3",
  PointType: "circle",
  circleSize: 2,
  rectWidth: 2,
  rectHeight: 2
} , [
  {chr: "10", pos: "100315722", value: "20.2218", des: "rs603424", color: "rgb(153,102,0)"},
  {chr: "10", pos: "101219450", value: "19", des: "rs11190870", color: "rgb(153,102,0)"},
  {chr: "10", pos: "103086421", value: "25.1549", des: "rs11191548", color: "rgb(153,102,0)"},
  {chr: "10", pos: "112998590", value: "74.0969", des: "rs7903146", color: "rgb(153,102,0)"},
  ......
  {chr: "X", pos: "5266661", value: "24.699", des: "rs6638512", color: "rgb(153,153,153)"},
  {chr: "X", pos: "67343176", value: "90.699", des: "rs2497938", color: "rgb(153,153,153)"},
  {chr: "X", pos: "69578860", value: "18.1549", des: "rs11796357", color: "rgb(153,153,153)"},
  {chr: "X", pos: "79241621", value: "32.699", des: "rs5912838", color: "rgb(153,153,153)"},
]];
- Including GWAS data SNP04_gwascatalog.js
Use <script> tag to include GWAS data SNP04_gwascatalog.js. And add the following code to gwas.html.
<!-- Data configuration -->
<script src="../data/get_started_gwas/SNP04_gwascatalog.js"></script>
- Initialize GWAS data in BioCircos.js with data tag : SNP04_gwascatalog
Here GWAS data’s data tag is defined as SNP04_gwascatalog. So add the following code to gwas.html.
BioCircos01 = new BioCircos(SNP04_gwascatalog,BioCircosGenome,{
Now, “gwas.html” is as follows:
<!DOCTYPE html>
<html>
    <head>
        <meta charset="utf-8">
        <title>BioCircos.js</title>
    </head>
    <body>
        <!-- BioCircos.js, Jquery.js and D3.js import -->
        <script src="../lib/jquery.js"></script>
        <script src="../lib/d3.js"></script>
        <script src="../lib/biocircos-1.1.0.js"></script>
        <!-- Prepare a <div> tag with "biocircos" id to set the picture position your will draw in html -->
        <div id="biocircos"></div>
<!-- Data configuration -->
<script src="../data/get_started_gwas/SNP04_gwascatalog.js"></script>
<!-- Genome configuration -->
<script>
  var BioCircosGenome = [
     ["1" , 249250621],
     ["2" , 243199373],
     ["3" , 198022430],
     ["4" , 191154276],
     ["5" , 180915260],
     ["6" , 171115067],
     ["7" , 159138663],
     ["8" , 146364022],
     ["9" , 141213431],
     ["10" , 135534747],
     ["11" , 135006516],
     ["12" , 133851895],
     ["13" , 115169878],
     ["14" , 107349540],
     ["15" , 102531392],
     ["16" , 90354753],
     ["17" , 81195210],
     ["18" , 78077248],
     ["19" , 59128983],
     ["20" , 63025520],
     ["21" , 48129895],
     ["22" , 51304566],
     ["X" , 155270560],
     ["Y" , 59373566]
  ];
  BioCircos01 = new BioCircos(SNP04_gwascatalog,BioCircosGenome,{  // Initialize BioCircos.js with "BioCircosGenome" and Main configuration
  //Main configuration
     target : "biocircos",                       // Main configuration "target"
     svgWidth : 900,                             // Main configuration "svgWidth"
     svgHeight : 600,                            // Main configuration "svgHeight"
     chrPad : 0.04,                              // Main configuration "chrPad"
     innerRadius: 246,                           // Main configuration "innerRadius"
     outerRadius: 270,                           // Main configuration "outerRadius"
  });
  BioCircos01.draw_genome(BioCircos01.genomeLength); // BioCircos.js callback
</script>
    </body>
</html>
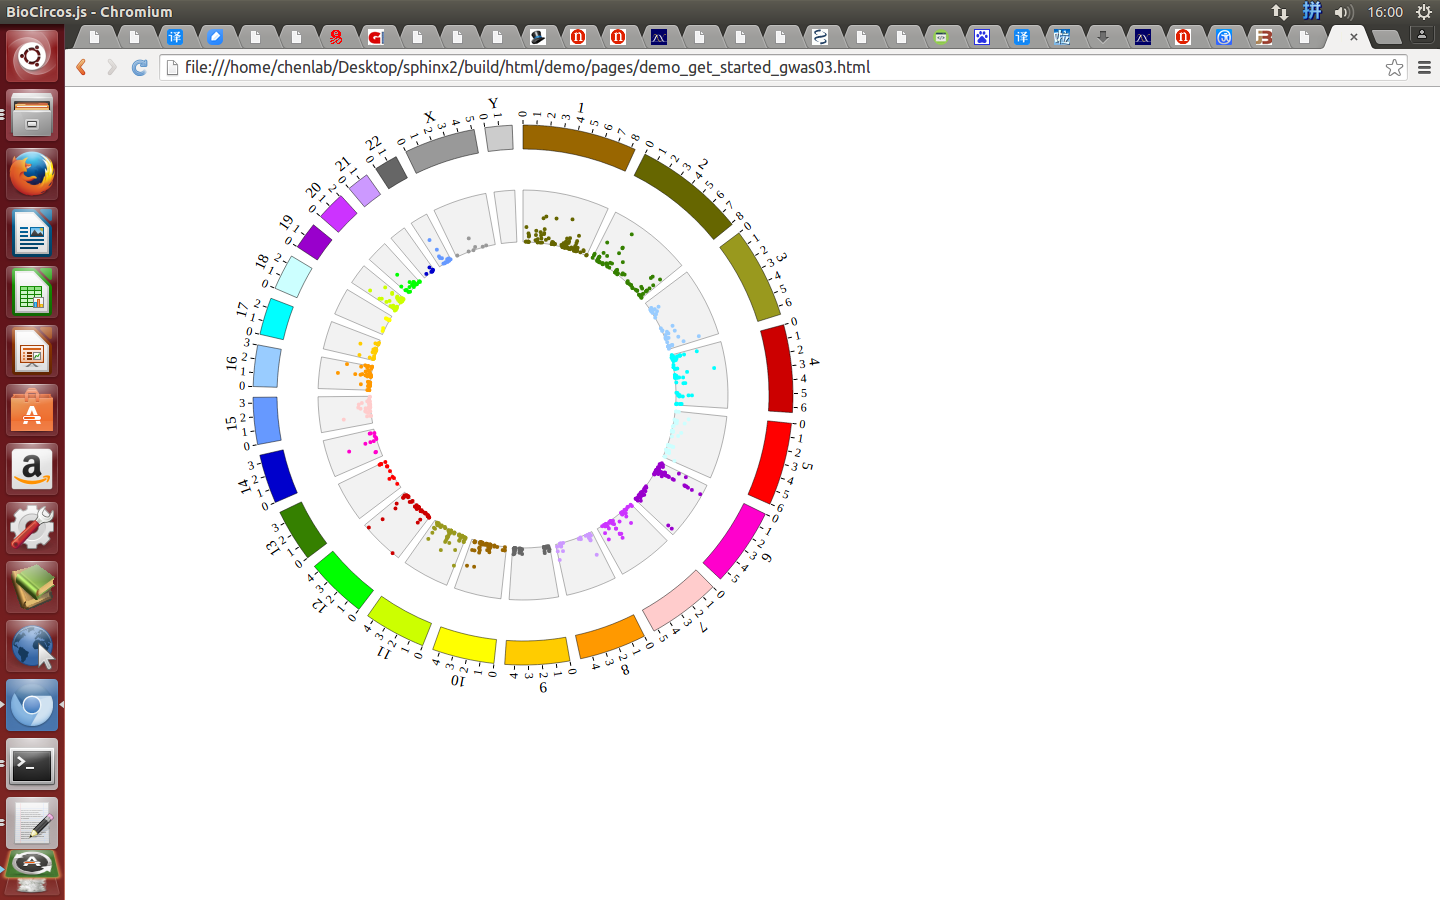
Open “gwas.html” file with your locale browser and view it as below:
Step5.2 Display Background using BACKGROUND module
- Including BACKGROUND module configuration
BACKGROUND module’s configuration is short. So we can also include BACKGROUND module as the way below.
Note
if your data in other module, such as SNP module, is not too much and the file is short, you can also include it as the way below.
<script>
var BACKGROUND01 = [ "BACKGROUND01" , {
  BginnerRadius: 205,
  BgouterRadius: 153,
  BgFillColor: "#F2F2F2",
  BgborderColor : "#000",
  BgborderSize : 0.3
}];
</script>
- Initialize BACKGROUND module with data tag : BACKGROUND01
Here the data tag is defined as BACKGROUND01. So add the following code to gwas.html.
BioCircos01 = new BioCircos(BACKGROUND01,SNP04_gwascatalog,BioCircosGenome,{
Now, “gwas.html” is as follows:
<!DOCTYPE html>
<html>
    <head>
        <meta charset="utf-8">
        <title>BioCircos.js</title>
    </head>
    <body>
        <!-- BioCircos.js, Jquery.js and D3.js import -->
        <script src="../lib/jquery.js"></script>
        <script src="../lib/d3.js"></script>
        <script src="../lib/biocircos-1.1.0.js"></script>
        <!-- Prepare a <div> tag with "biocircos" id to set the picture position your will draw in html -->
        <div id="biocircos"></div>
<!-- Data configuration -->
<script src="../data/get_started_gwas/SNP04_gwascatalog.js"></script>
<script>
var BACKGROUND01 = [ "BACKGROUND01" , {
  BginnerRadius: 205,
  BgouterRadius: 153,
  BgFillColor: "#F2F2F2",
  BgborderColor : "#000",
  BgborderSize : 0.3
}];
</script>
<!-- Genome configuration -->
<script>
  var BioCircosGenome = [
     ["1" , 249250621],
     ["2" , 243199373],
     ["3" , 198022430],
     ["4" , 191154276],
     ["5" , 180915260],
     ["6" , 171115067],
     ["7" , 159138663],
     ["8" , 146364022],
     ["9" , 141213431],
     ["10" , 135534747],
     ["11" , 135006516],
     ["12" , 133851895],
     ["13" , 115169878],
     ["14" , 107349540],
     ["15" , 102531392],
     ["16" , 90354753],
     ["17" , 81195210],
     ["18" , 78077248],
     ["19" , 59128983],
     ["20" , 63025520],
     ["21" , 48129895],
     ["22" , 51304566],
     ["X" , 155270560],
     ["Y" , 59373566]
  ];
  BioCircos01 = new BioCircos(BACKGROUND01,SNP04_gwascatalog,BioCircosGenome,{  // Initialize BioCircos.js with "BioCircosGenome" and Main configuration
  //Main configuration
     target : "biocircos",                       // Main configuration "target"
     svgWidth : 900,                             // Main configuration "svgWidth"
     svgHeight : 600,                            // Main configuration "svgHeight"
     chrPad : 0.04,                              // Main configuration "chrPad"
     innerRadius: 246,                           // Main configuration "innerRadius"
     outerRadius: 270,                           // Main configuration "outerRadius"
  });
  BioCircos01.draw_genome(BioCircos01.genomeLength); // BioCircos.js callback
</script>
    </body>
</html>
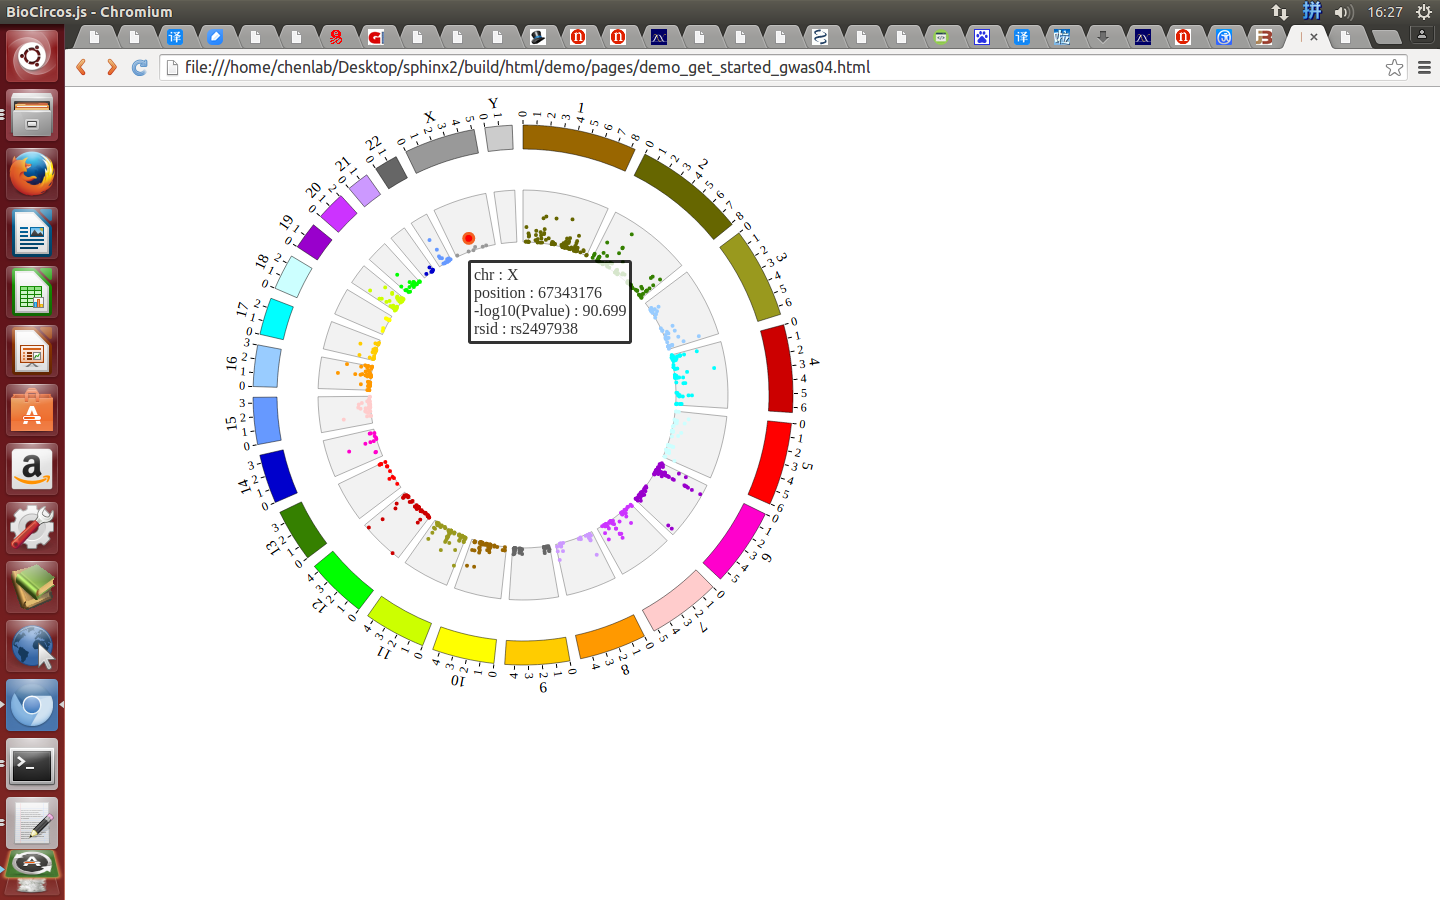
Open “gwas.html” file with your locale browser and view it as below:
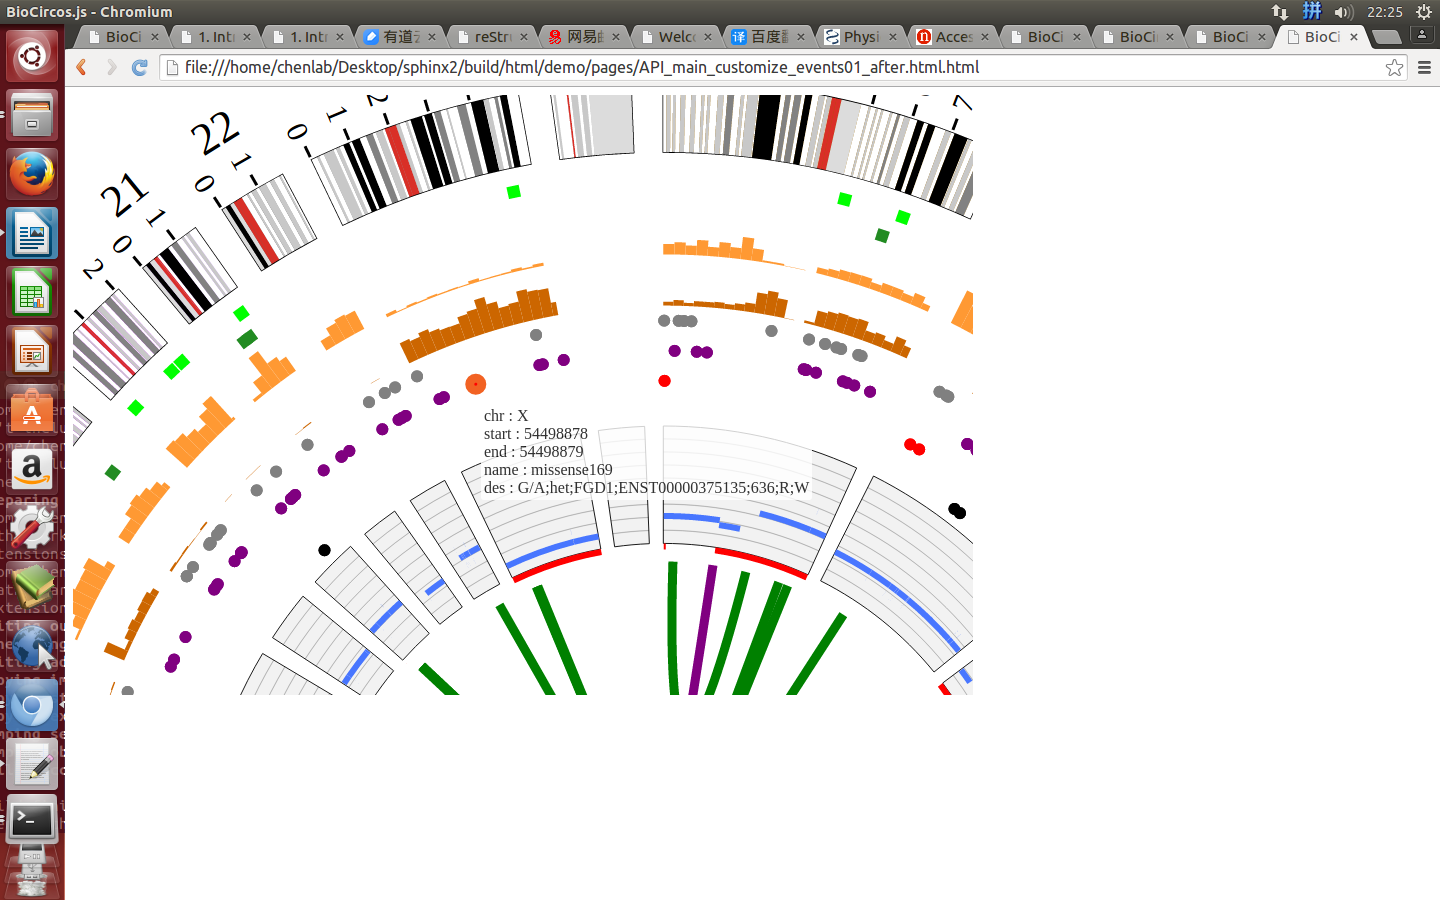
Step5.3 Open MouseOver and MouseOut events of SNP module in “Main configuration”
- Here we configure “Customize Events” and “Customize Tooltips” two classes in “Main configuration” to open MouseOver and MouseOut events. More attributes can be found in “Main configuration” part of this document. Attributes used here are below:
| Main configuration | Value | Class | Description |
|---|---|---|---|
SNPMouseOverDisplay |
true | Customize Events | default false, [true/false], open/not open mouse mouse Over event of SNP module |
SNPMouseOverColor |
“red” | Customize Events | default “red”, “none” means no change, element change color after mouse Over the element |
SNPMouseOverCircleSize |
5 | Customize Events | default 2, “none” means no change, element change circle size after mouse Over the element |
SNPMouseOverCircleOpacity |
1.0 | Customize Events | default 1.0, “none” means no change, element change opacity after mouse Over the element |
SNPMouseOverCircleStrokeColor |
“#F26223” | Customize Events | default “#F26223”, “none” means no change, element change stroke color after mouse Over the element |
SNPMouseOverCircleStrokeWidth |
3 | Customize Events | default 3, “none” means no change, element change stroke width after mouse Over the element |
SNPMouseOverTooltipsHtml01 |
“chr : “ | Customize Tooltips | default “chr : “ |
SNPMouseOverTooltipsHtml02 |
“<br>position : “ | Customize Tooltips | default “<br>position : “ |
SNPMouseOverTooltipsHtml03 |
“<br>-log10(Pvalue) : “ | Customize Tooltips | default “<br>value : “ |
SNPMouseOverTooltipsHtml04 |
“<br>rsid : “ | Customize Tooltips | default “<br>des : “ |
SNPMouseOverTooltipsHtml05 |
default “” | Customize Tooltips | default |
SNPMouseOverTooltipsBorderWidth |
1 | Customize Tooltips | default 0 |
SNPMouseOutDisplay |
true | Customize Events | default false, [true/false], open/not open mouse mouse out event of SNP module |
SNPMouseOutAnimationTime |
700 | Customize Events | default 500, animation time after mouse out the element |
SNPMouseOutColor |
“none” | Customize Events | default “red”, “none” means no change, element change color after mouse out the element |
SNPMouseOutCircleSize |
“none” | Customize Events | default 2, “none” means no change, element change circle size after mouse out the element |
SNPMouseOutCircleOpacity |
1.0 | Customize Events | default 1.0, “none” means no change, element change opacity after mouse out the element |
SNPMouseOutCircleStrokeWidth |
0 | Customize Events | default 0, “none” means no change, element change stroke width after mouse out the element |
BioCircos01 = new BioCircos(BACKGROUND01,SNP04_gwascatalog,BioCircosGenome,{
//Main configuration
   target : "biocircos",
   svgWidth : 900,
   svgHeight : 600,
   chrPad : 0.04,
   innerRadius: 246,
   outerRadius: 270,
   SNPMouseOverDisplay : true,
   SNPMouseOverColor : "red",
   SNPMouseOverCircleSize : 5,
   SNPMouseOverCircleOpacity : 1.0,
   SNPMouseOverCircleStrokeColor : "#F26223",
   SNPMouseOverCircleStrokeWidth : 3,
   SNPMouseOverTooltipsHtml01 : "chr : ",
   SNPMouseOverTooltipsHtml02 : "<br>position : ",
   SNPMouseOverTooltipsHtml03 : "<br>-log10(Pvalue) : ",
   SNPMouseOverTooltipsHtml04 : "<br>rsid : ",
   SNPMouseOverTooltipsHtml05 : "",
   SNPMouseOverTooltipsBorderWidth : 1,
   SNPMouseOutDisplay : true,
   SNPMouseOutAnimationTime : 700,
   SNPMouseOutColor : "none",
   SNPMouseOutCircleSize : "none",
   SNPMouseOutCircleOpacity : 1.0,
   SNPMouseOutCircleStrokeWidth : 0,
});
Now, “gwas.html” is as follows:
<!DOCTYPE html>
<html>
    <head>
        <meta charset="utf-8">
        <title>BioCircos.js</title>
    </head>
    <body>
        <!-- BioCircos.js, Jquery.js and D3.js import -->
        <script src="../lib/jquery.js"></script>
        <script src="../lib/d3.js"></script>
        <script src="../lib/biocircos-1.1.0.js"></script>
        <!-- Prepare a <div> tag with "biocircos" id to set the picture position your will draw in html -->
        <div id="biocircos"></div>
<!-- Data configuration -->
<script src="../data/get_started_gwas/SNP04_gwascatalog.js"></script>
<script>
var BACKGROUND01 = [ "BACKGROUND01" , {
  BginnerRadius: 205,
  BgouterRadius: 153,
  BgFillColor: "#F2F2F2",
  BgborderColor : "#000",
  BgborderSize : 0.3
}];
</script>
<!-- Genome configuration -->
<script>
  var BioCircosGenome = [
     ["1" , 249250621],
     ["2" , 243199373],
     ["3" , 198022430],
     ["4" , 191154276],
     ["5" , 180915260],
     ["6" , 171115067],
     ["7" , 159138663],
     ["8" , 146364022],
     ["9" , 141213431],
     ["10" , 135534747],
     ["11" , 135006516],
     ["12" , 133851895],
     ["13" , 115169878],
     ["14" , 107349540],
     ["15" , 102531392],
     ["16" , 90354753],
     ["17" , 81195210],
     ["18" , 78077248],
     ["19" , 59128983],
     ["20" , 63025520],
     ["21" , 48129895],
     ["22" , 51304566],
     ["X" , 155270560],
     ["Y" , 59373566]
  ];

  BioCircos01 = new BioCircos(BACKGROUND01,SNP04_gwascatalog,BioCircosGenome,{
  //Main configuration
     target : "biocircos",
     svgWidth : 900,
     svgHeight : 600,
     chrPad : 0.04,
     innerRadius: 246,
     outerRadius: 270,
     SNPMouseOverDisplay : true,
     SNPMouseOverColor : "red",
     SNPMouseOverCircleSize : 5,
     SNPMouseOverCircleOpacity : 1.0,
     SNPMouseOverCircleStrokeColor : "#F26223",
     SNPMouseOverCircleStrokeWidth : 3,
     SNPMouseOverTooltipsHtml01 : "chr : ",
     SNPMouseOverTooltipsHtml02 : "<br>position : ",
     SNPMouseOverTooltipsHtml03 : "<br>-log10(Pvalue) : ",
     SNPMouseOverTooltipsHtml04 : "<br>rsid : ",
     SNPMouseOverTooltipsHtml05 : "",
     SNPMouseOverTooltipsBorderWidth : 1,
     SNPMouseOutDisplay : true,
     SNPMouseOutAnimationTime : 700,
     SNPMouseOutColor : "none",
     SNPMouseOutCircleSize : "none",
     SNPMouseOutCircleOpacity : 1.0,
     SNPMouseOutCircleStrokeWidth : 0,
  });
  BioCircos01.draw_genome(BioCircos01.genomeLength);
</script>
    </body>
</html>
Open “gwas.html” file with your locale browser and view it as below:
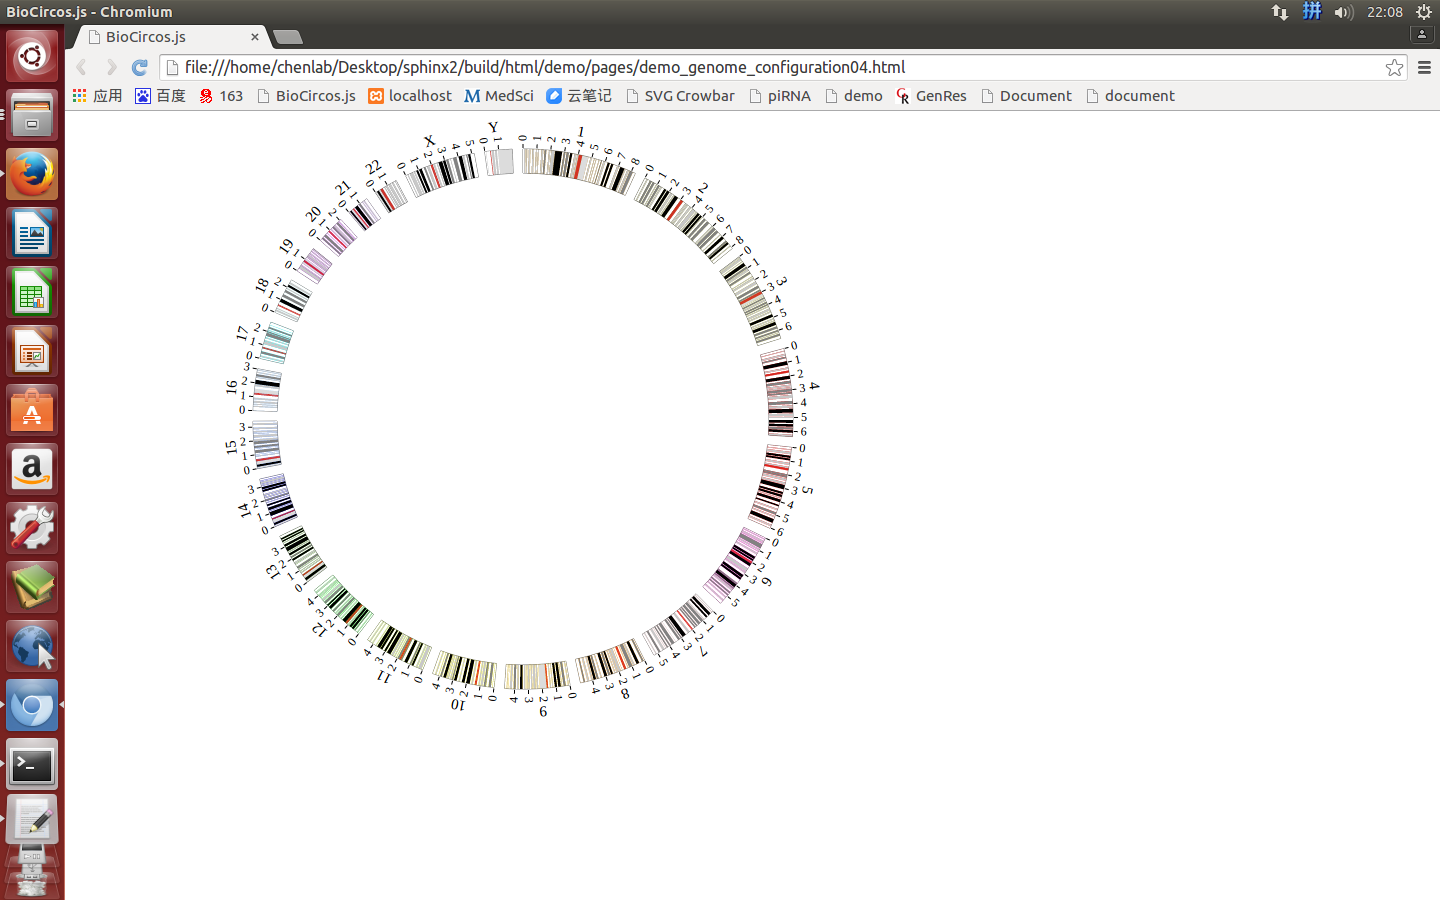
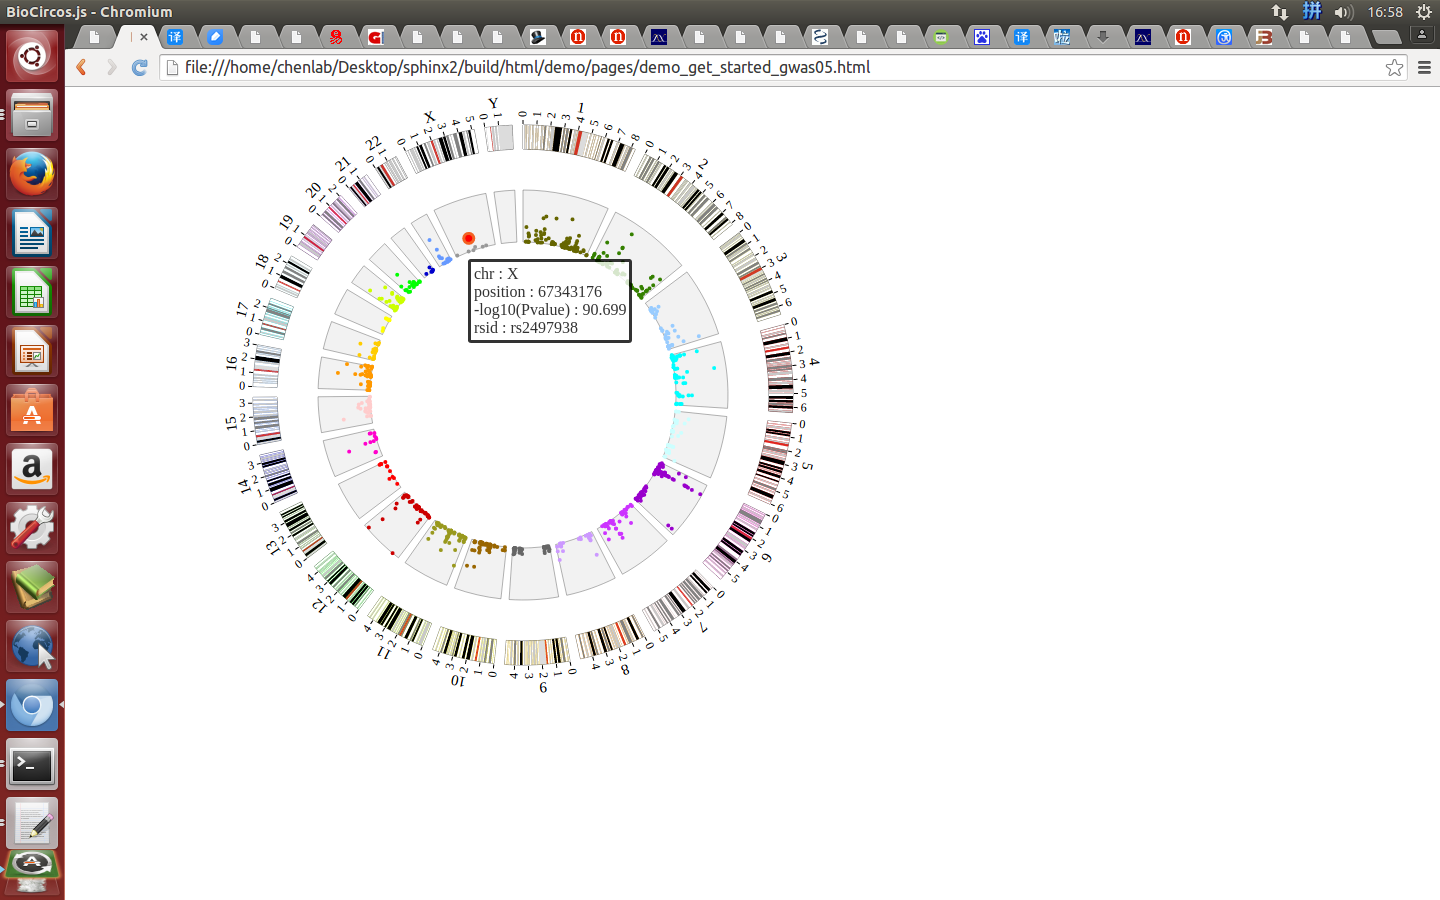
Step5.4 Dispaly Chromosome band using ARC module
The chromosome band represents the approximate location of bands seen on Giemsa-stained chromosomes. We have provided some commonly used genomes as below. The color of chromosome band is the same as Circos.
| Species | Genome version | Data name | Genome | cytoBand in UCSC |
|---|---|---|---|---|
| Human | grch38 | ARC_grch38 | genome | karyotype.human.grch38.js |
| Human | hg19 | ARC_hg19 | genome | karyotype.human.hg19.js |
| human | hg18 | ARC_hg18 | genome | karyotype.human.hg18.js |
| Mouse | mm10 | ARC_mm10 | genome | karyotype.mouse.mm10.js |
| Mouse | mm9 | ARC_mm9 | genome | karyotype.mouse.mm9.js |
Here we take hg19 as an example to explain how to build these files.
- Input chromosome band data
We download chromosome band data from UCSC. Then we follow Circos’s color settings on chromosome band to add the color column. We saved the data in karyotype.human.hg19.txt, as below:
1       0       2300000 rgb(255,255,255)
1       2300000 5400000 rgb(200,200,200)
1       5400000 7200000 rgb(255,255,255)
1       7200000 9200000 rgb(200,200,200)
......
Y       19800000        22100000        rgb(255,255,255)
Y       22100000        26200000        rgb(200,200,200)
Y       26200000        28800000        rgb(255,255,255)
Y       28800000        59373566        rgb(220,220,220)
- Use “Data Preparation Tools” to prepare data
Note
You need to install the python 2, before running Biocircos_PrepareData.py. You can skip this step, just download karyotype.human.hg19.js for the next step.
We provide a python program Biocircos_PrepareData.py to help users prepare the input data for each module of BioCircos.js
python Biocircos_PrepareData.py ARC karyotype.human.hg19.txt > karyotype.human.hg19.js
Move karyotype.human.hg19.js to ./biocircos_demos/data/ in your locale.
- Output chromosome band data used in BioCircos.js
ARC_hg19 = [ "ARC_hg19" , {
  innerRadius: -0,
  outerRadius: -0,
} , [
  {chr: "1", start: "0" , end: "2300000", color: "rgb(255,255,255)"},
  {chr: "1", start: "2300000" , end: "5400000", color: "rgb(200,200,200)"},
  {chr: "1", start: "5400000" , end: "7200000", color: "rgb(255,255,255)"},
  {chr: "1", start: "7200000" , end: "9200000", color: "rgb(200,200,200)"},
  ......
  {chr: "Y", start: "19800000" , end: "22100000", color: "rgb(255,255,255)"},
  {chr: "Y", start: "22100000" , end: "26200000", color: "rgb(200,200,200)"},
  {chr: "Y", start: "26200000" , end: "28800000", color: "rgb(255,255,255)"},
  {chr: "Y", start: "28800000" , end: "59373566", color: "rgb(220,220,220)"},
]];
- Including chromosome band data karyotype.human.hg19.js
Use <script> tag to include chromosome band data karyotype.human.hg19.js. And add the following code to gwas.html.
<!-- Data configuration -->
<script src="../data/get_started_gwas/karyotype.human.hg19.js"></script>
- Initialize chromosome band data in BioCircos.js with data tag : ARC_hg19
Here chromosome band data’s data tag is defined as ARC_hg19. So add the following code to gwas.html.
BioCircos01 = new BioCircos(ARC_hg19,SNP04_gwascatalog,BioCircosGenome,{
Now, “gwas.html” is as follows:
<!DOCTYPE html>
<html>
    <head>
        <meta charset="utf-8">
        <title>BioCircos.js</title>
    </head>
    <body>
        <!-- BioCircos.js, Jquery.js and D3.js import -->
        <script src="../lib/jquery.js"></script>
        <script src="../lib/d3.js"></script>
        <script src="../lib/biocircos-1.1.0.js"></script>
        <!-- Prepare a <div> tag with "biocircos" id to set the picture position your will draw in html -->
        <div id="biocircos"></div>
<!-- Data configuration -->
<script src="../data/karyotype.human.hg19.js"></script>
<script src="../data/get_started_gwas/SNP04_gwascatalog.js"></script>
<script>
var BACKGROUND01 = [ "BACKGROUND01" , {
  BginnerRadius: 205,
  BgouterRadius: 153,
  BgFillColor: "#F2F2F2",
  BgborderColor : "#000",
  BgborderSize : 0.3
}];
</script>
<!-- Genome configuration -->
<script>
  var BioCircosGenome = [
     ["1" , 249250621],
     ["2" , 243199373],
     ["3" , 198022430],
     ["4" , 191154276],
     ["5" , 180915260],
     ["6" , 171115067],
     ["7" , 159138663],
     ["8" , 146364022],
     ["9" , 141213431],
     ["10" , 135534747],
     ["11" , 135006516],
     ["12" , 133851895],
     ["13" , 115169878],
     ["14" , 107349540],
     ["15" , 102531392],
     ["16" , 90354753],
     ["17" , 81195210],
     ["18" , 78077248],
     ["19" , 59128983],
     ["20" , 63025520],
     ["21" , 48129895],
     ["22" , 51304566],
     ["X" , 155270560],
     ["Y" , 59373566]
  ];

  BioCircos01 = new BioCircos(ARC_hg19,BACKGROUND01,SNP04_gwascatalog,BioCircosGenome,{
  //Main configuration
     target : "biocircos",
     svgWidth : 900,
     svgHeight : 600,
     chrPad : 0.04,
     innerRadius: 246,
     outerRadius: 270,
     SNPMouseOverDisplay : true,
     SNPMouseOverColor : "red",
     SNPMouseOverCircleSize : 5,
     SNPMouseOverCircleOpacity : 1.0,
     SNPMouseOverCircleStrokeColor : "#F26223",
     SNPMouseOverCircleStrokeWidth : 3,
     SNPMouseOverTooltipsHtml01 : "chr : ",
     SNPMouseOverTooltipsHtml02 : "<br>position : ",
     SNPMouseOverTooltipsHtml03 : "<br>-log10(Pvalue) : ",
     SNPMouseOverTooltipsHtml04 : "<br>rsid : ",
     SNPMouseOverTooltipsHtml05 : "",
     SNPMouseOverTooltipsBorderWidth : 1,
     SNPMouseOutDisplay : true,
     SNPMouseOutAnimationTime : 700,
     SNPMouseOutColor : "none",
     SNPMouseOutCircleSize : "none",
     SNPMouseOutCircleOpacity : 1.0,
     SNPMouseOutCircleStrokeWidth : 0,
  });
  BioCircos01.draw_genome(BioCircos01.genomeLength);
</script>
    </body>
</html>
Open “gwas.html” file with your locale browser and view it as below:
4. Function Modules and Data Preparation Tools
“Function Modules” are designed for specific biological data and graphic elements, which currently contains 10 modules, and later will be expanded according to the needs.
“Data configuration” is designed for “Function Modules” in BioCircos.js. According to “Function Modules” division, “Data configuration” includes ten parts.
| Function Modules | For Biological Data | Need “Data Preparation Tools” |
|---|---|---|
| SNP module | SNP with value; GWAS data... | Yes |
| SCATTER module | SNP without value; Genes data... | Yes |
| LINK module | Gene fusions; Interaction; SV... | Yes |
| CNV module | CNV with value... | Yes |
| ARC module | CNV without value; Gene domain; Chromosome band... | Yes |
| HEATMAP module | Gene expression... | Yes |
| HISTOGRAM module | Gene expression... | Yes |
| LINE module | Gene expression... | Yes |
| BACKGROUND module | Display background and axis circles | No |
| TEXT module | Assigning annotation text | No |
We also have provided a python program Biocircos_PrepareData.py as “Data Preparation Tools” to prepare the input data for almost all “Function Modules” except “BACKGROUND” and “TEXT” module. Below will use this tool to introduce how to prepare the data for each module.
4.1 Biocircos_PrepareData.py
We provide a python program Biocircos_PrepareData.py to help users prepare the input data for each module of BioCircos.js.
Note
If you are familiar with a script language such as Python, Perl, Shell, you can also convert the data format by yourself. Data format is defined in “6. API: Data configuration”.
You need to install Python 2* before running Biocircos_PrepareData.py. The usage of Biocircos_PrepareData.py is as below:
Python Version: Python 2.7.3

Usage:

python Biocircos_PrepareData.py <module: SNP|SCATTER|LINK|CNV|ARC|HEATMAP|HISTOGRAM|LINE|BACKGROUND|TEXT> <input: input.txt>  >  <output:output.js>

Arguments:

module: Specify the module name of BioCircos.js, including SNP,SCATTER,LINK,CNV,ARC,HEATMAP,HISTOGRAM,LINE,BACKGROUND and TEXT
input : input data input.txt
output: output data output.js

Example:

python Biocircos_PrepareData.py SNP SNP01.txt > SNP01.js
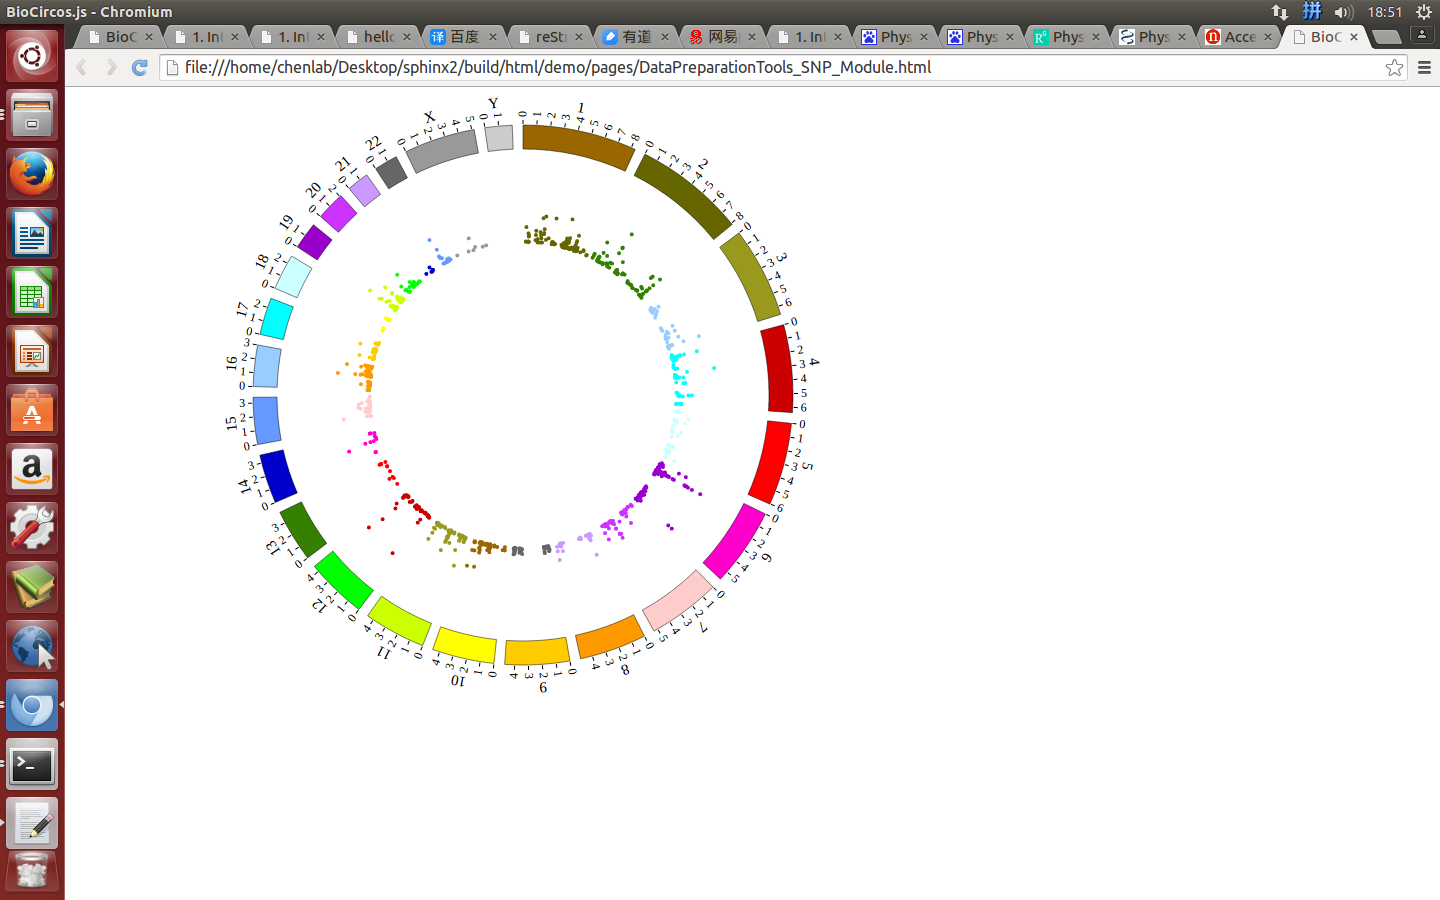
4.2 SNP module
“SNP module” is used to display the SNP density data, GWAS data, etc. Of course, other data have similar structure can also be displayed by SNP module.
Note
We will use four steps to illustrate the input data preparation and how to use SNP module, below is an example.
(1) SNP data preparation
Input data
Users should prepare the input data in the following format (separated by tabs).
#chr    pos     value   des
10      100315722       20.2218 rs603424
10      101219450       19      rs11190870
10      103086421       25.1549 rs11191548
10      112998590       74.0969 rs7903146
 ......
X       5266661 24.699  rs6638512
X       67343176        90.699  rs2497938
X       69578860        18.1549 rs11796357
X       79241621        32.699  rs5912838
- The 1 column(
chr) is the name of the chromosome. - The 2 column(
pos) is the position of the SNP. - The 3 column(
value) is the value(density, P-value, etc.) of the SNP. - The 4 column(
des) is the description of the SNP.
Save the input data to “SNP01.txt”, Use “Biocircos_PrepareData.py” to prepare data
python Biocircos_PrepareData.py SNP SNP01.txt > SNP01.js
Output data used in BioCircos.js
Change the default configuration, such as minRadius, and finally SNP01.js is in the following:
var SNP01 = [ "SNP01" , {
  maxRadius: 205,
  minRadius: 153,
  SNPFillColor: "#9400D3",
  PointType: "circle",
  circleSize: 2,
  rectWidth: 2,
  rectHeight: 2
} , [
  {chr: "10", pos: "100315722", value: "20.2218", des: "rs603424", color: "rgb(153,102,0)"},
  {chr: "10", pos: "101219450", value: "19", des: "rs11190870", color: "rgb(153,102,0)"},
  {chr: "10", pos: "103086421", value: "25.1549", des: "rs11191548", color: "rgb(153,102,0)"},
  {chr: "10", pos: "112998590", value: "74.0969", des: "rs7903146", color: "rgb(153,102,0)"},
  {chr: "10", pos: "121577821", value: "169.699", des: "rs2981579", color: "rgb(153,102,0)"},
   ......
  {chr: "X", pos: "5266661", value: "24.699", des: "rs6638512", color: "rgb(153,153,153)"},
  {chr: "X", pos: "67343176", value: "90.699", des: "rs2497938", color: "rgb(153,153,153)"},
  {chr: "X", pos: "69578860", value: "18.1549", des: "rs11796357", color: "rgb(153,153,153)"},
  {chr: "X", pos: "79241621", value: "32.699", des: "rs5912838", color: "rgb(153,153,153)"},
]];
(2) Including SNP data
Use <script> tag to include SNP01.js.
<script src="../data/data_prepare/SNP01.js"></script>
(3) Initialize SNP data with data tag : SNP01
Here the data’s data tag is defined as SNP01.
BioCircos01 = new BioCircos(SNP01,BioCircosGenome,{ // Initialize with "SNP01" data tag
(4) Visualization of SNP module using BioCircos.js
4.3 SCATTER module
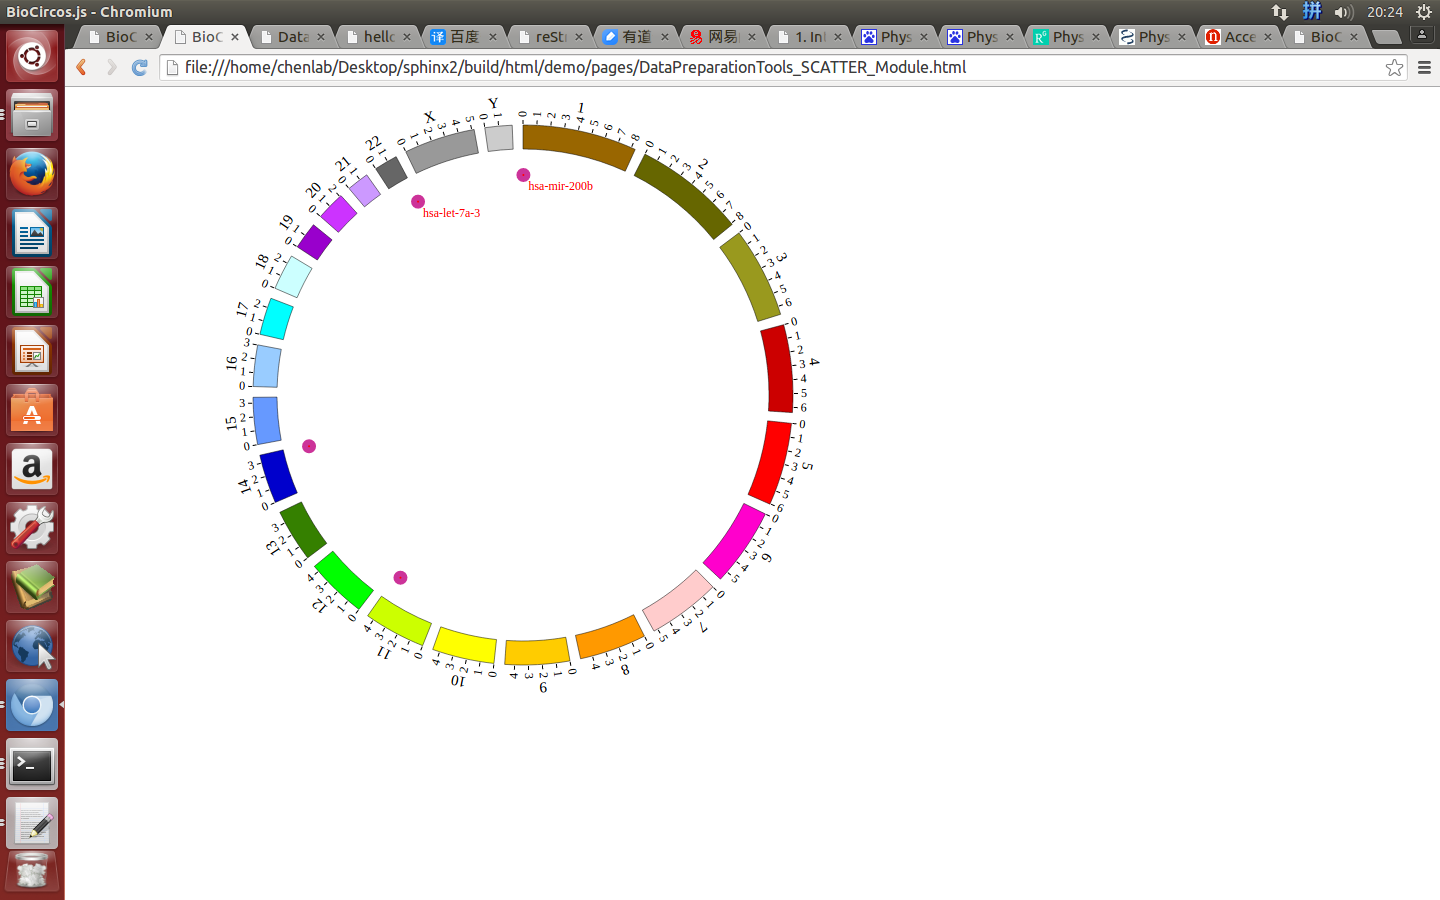
“SCATTER module” is used to display the SNP without value, Genes data, etc. Of course, other data have similar structure can also be displayed by SCATTER module.
Note
We will use four steps to illustrate the input data preparation and how to use SCATTER module, below is an example.
- Input data: SCATTER01.txt
- Input data used in BioCircos.js: SCATTER01.js
(1) SCATTER data preparation
Input data
Users should prepare the input data in the following format (separated by tabs).
#chr    start   end     name    des
1       1102484 1102578 hsa-mir-200b    breast cancer
11      122017230       122017301       hsa-let-7a-2    ovarian cancer
22      46508629        46508702        hsa-let-7a-3    leukemia cancer
14      101349316       101349412       hsa-mir-127     breast cancer
Five fields are required:
- The 1 column(
chr) is the name of the chromosome. - The 2 column(
start) is the start position of the scatter. - The 3 column(
end) is the end position of the scatter. - The 4 column(
name) is the name of the scatter. - The 5 column(
des) is the description of the scatter.
Save the input data to “SCATTER01.txt”, Use “Biocircos_PrepareData.py” to prepare data
python Biocircos_PrepareData.py SCATTER SCATTER01.txt > SCATTER01.js
Output data used in BioCircos.js
Change the default configuration, and finally SCATTER01.js is in the following:
var SCATTER01 = [ "SCATTER01" , {
  SCATTERRadius: 220,
  innerCircleSize: 1,
  outerCircleSize: 7,
  innerCircleColor: "red",
  outerCircleColor: "#CC3399",
  innerPointType: "circle", //circle,rect
  outerPointType: "circle", //circle,rect
  innerrectWidth: 2,
  innerrectHeight: 2,
  outerrectWidth: 10,
  outerrectHeight: 10,
  outerCircleOpacity: 1,
  random_data: 0
} , [
  {chr: "1", start: "1102484", end: "1102578", name: "hsa-mir-200b", des: "breast cancer"},
  {chr: "11", start: "122017230", end: "122017301", name: "hsa-let-7a-2", des: "ovarian cancer"},
  {chr: "22", start: "46508629", end: "46508702", name: "hsa-let-7a-3", des: "leukemia cancer"},
  {chr: "14", start: "101349316", end: "101349412", name: "hsa-mir-127", des: "breast cancer"},
]];
(2) Including SCATTER data
Use <script> tag to include SCATTER01.js.
<script src="../data/data_prepare/SCATTER01.js"></script>
(3) Initialize SCATTER data with data tag : SCATTER01
Here the data’s data tag is defined as SCATTER01.
BioCircos01 = new BioCircos(SCATTER01,BioCircosGenome,{ // Initialize with "SCATTER01" data tag
(4) Visualization of SCATTER data using BioCircos.js
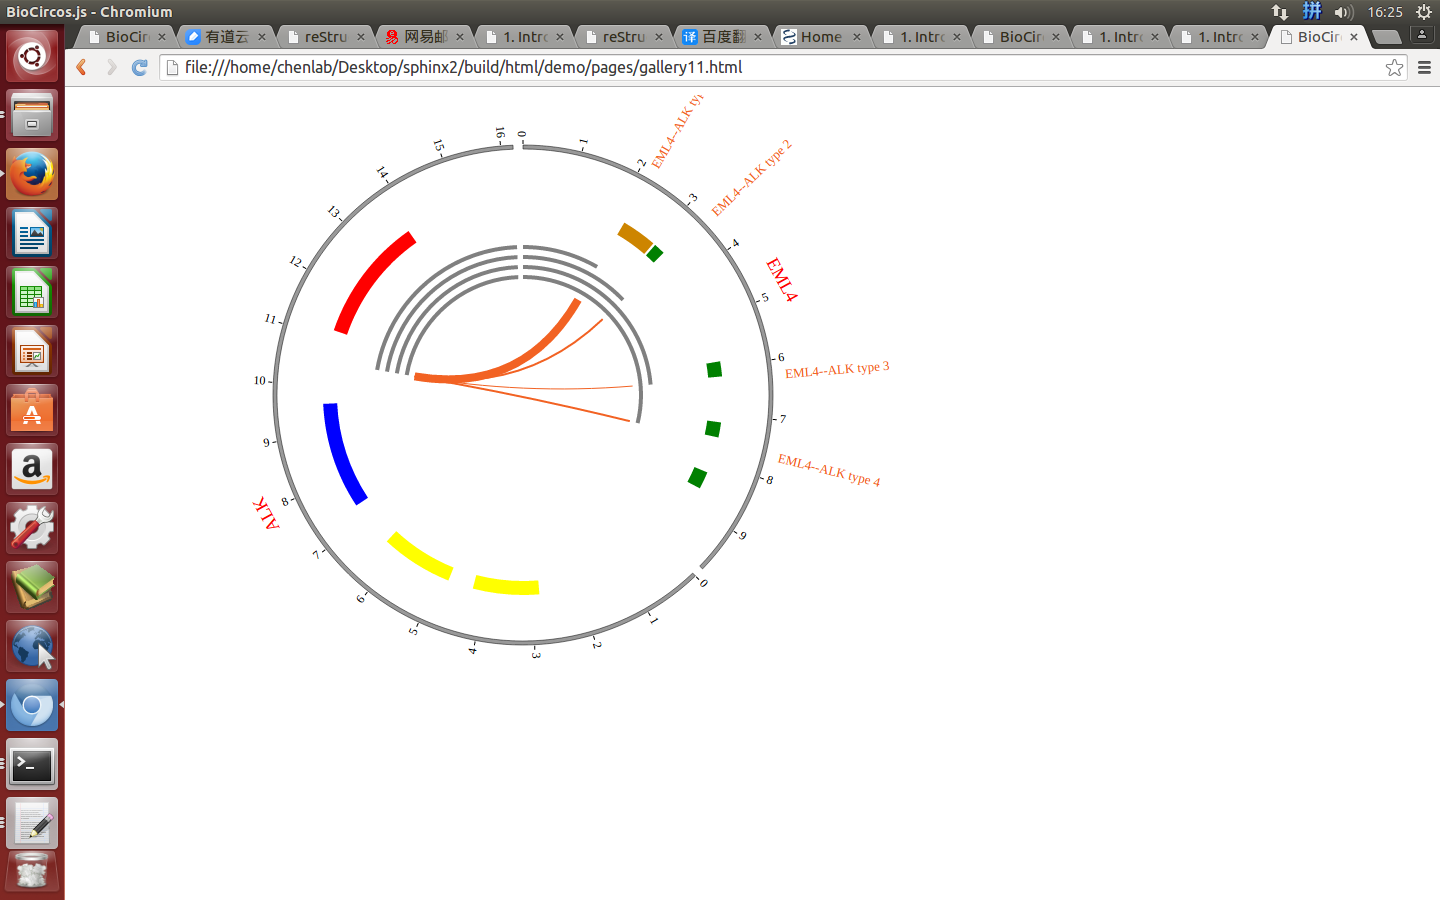
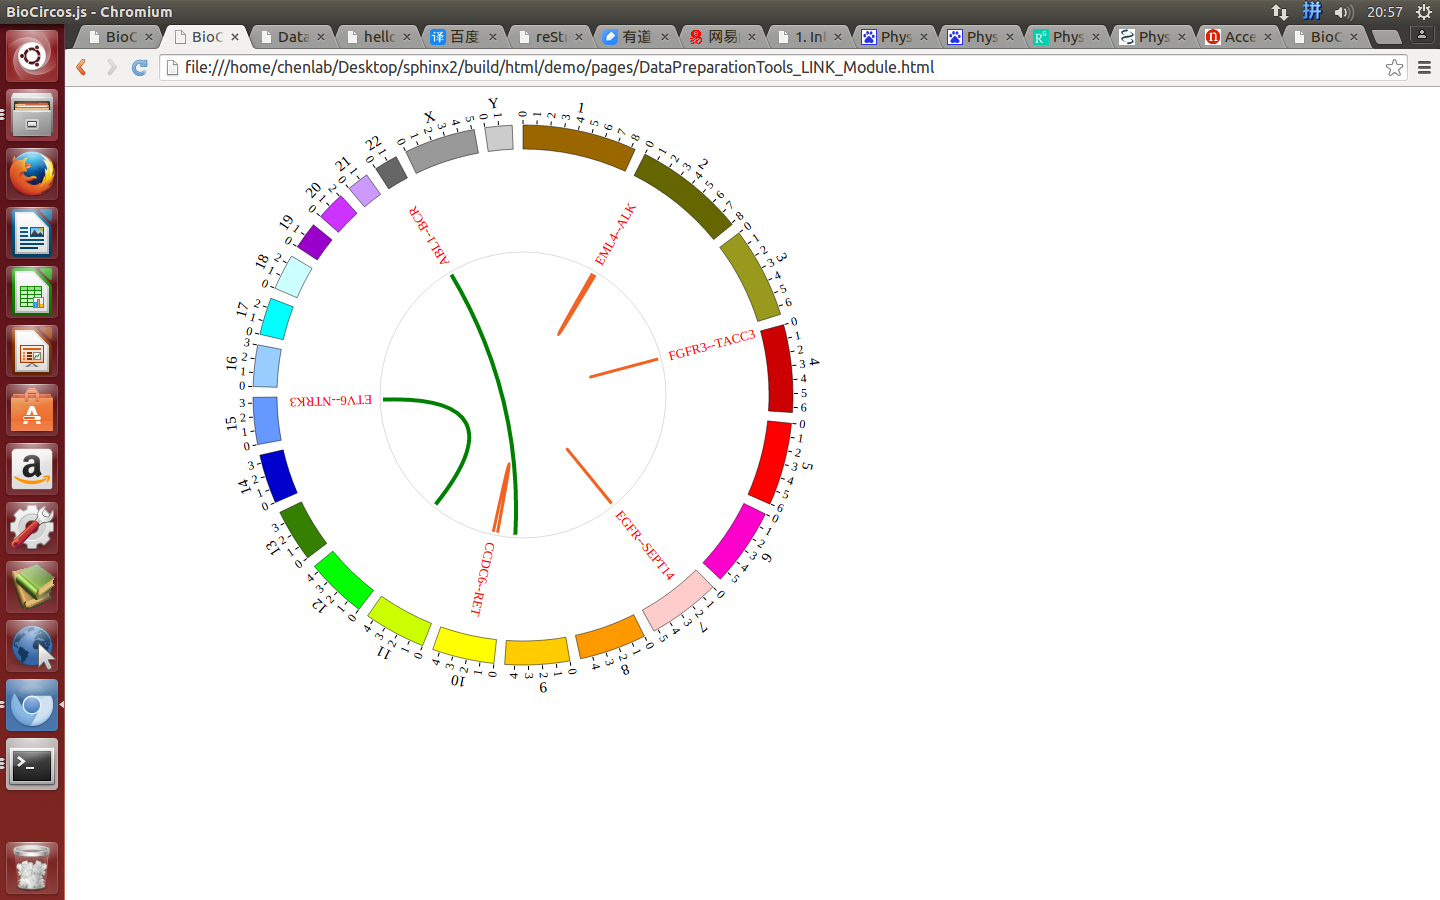
4.4 LINK module
“LINK module” is used to display the Gene fusions data, Interaction data, “SV data” etc. Of course, other data have similar structure can also be displayed by LINK module.
Note
We will use four steps to illustrate the input data preparation and how to use LINK module, below is an example.
- Input data: LINK01.txt
- Input data used in BioCircos.js: LINK01.js
(1) LINK data preparation
Input data
Users should prepare the input data in the following format (separated by tabs).
#name   g1chr   g1start g1end   g1name  g2chr   g2start g2end   g2name
FGFR3--TACC3    4       1795662 1808986 FGFR3   4       1723217 1746905 TACC3
CCDC6--RET      10      43595894        43623714        RET     10      61552678        61666182        TACC3
ETV6--NTRK3     12      11905384        12043977        ETV6    15      88420169        88799384        NTRK3
EGFR--SEPT14    7       55086971        55273307        EGFR    7       55861237        55930482        SEPT14
EML4--ALK       2       42472644        42557344        EML4    2       29416093        30143525        ALK
ABL1--BCR       9       133589707       133761067       ABL1    22      23523148        23657706        BCR
Nine fields are required:
- The 1 column(
name) is the name of the link. - The 2 column(
g1chr) is the chromosome of gene 1. - The 3 column(
g1start) is the start of gene 1. - The 4 column(
g1end) is the end of gene 1. - The 5 column(
g1name) is the name of gene 1. - The 6 column(
g2chr) is the chromosome of gene 2. - The 7 column(
g2start) is the start of gene 2. - The 8 column(
g2end) is the end of gene 2. - The 9 column(
g2name) is the name of gene 2.
Save the input data to “LINK01.txt”, Use “Biocircos_PrepareData.py” to prepare data
python Biocircos_PrepareData.py LINK LINK01.txt > LINK01.js
Output data used in BioCircos.js
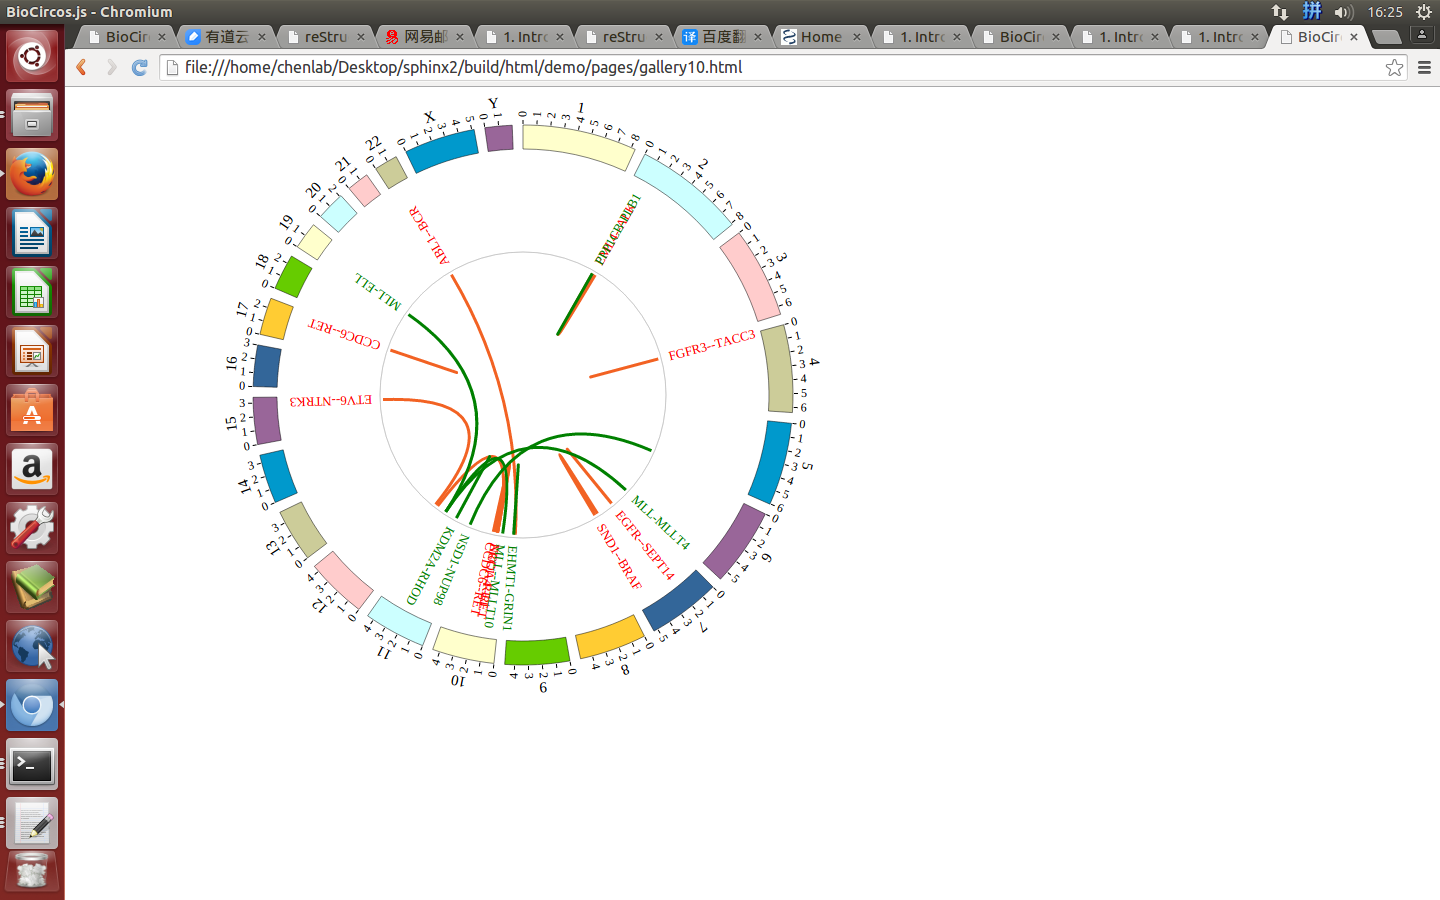
Change the default configuration, and finally LINK01.js is in the following:
var LINK01 = [ "LINK01" , {
  LinkRadius: 140,
  LinkFillColor: "#F26223",
  LinkWidth: 3,
  displayLinkAxis: true,
  LinkAxisColor: "#B8B8B8",
  LinkAxisWidth: 0.5,
  LinkAxisPad: 3,
  displayLinkLabel: true,
  LinkLabelColor: "red",
  LinkLabelSize: 13,
  LinkLabelPad: 8,
} , [
  {fusion: "FGFR3--TACC3", g1chr: "4", g1start: "1795662", g1end: "1808986", g1name: "FGFR3", g2chr: "4", g2start: "1723217", g2end: "1746905", g2name: "TACC3"},
  {fusion: "CCDC6--RET", g1chr: "10", g1start: "43595894", g1end: "43623714", g1name: "RET", g2chr: "10", g2start: "61552678", g2end: "61666182", g2name: "TACC3"},
  {fusion: "ETV6--NTRK3", g1chr: "12", g1start: "11905384", g1end: "12043977", g1name: "ETV6", g2chr: "15", g2start: "88420169", g2end: "88799384", g2name: "NTRK3"},
  {fusion: "EGFR--SEPT14", g1chr: "7", g1start: "55086971", g1end: "55273307", g1name: "EGFR", g2chr: "7", g2start: "55861237", g2end: "55930482", g2name: "SEPT14"},
  {fusion: "EML4--ALK", g1chr: "2", g1start: "42472644", g1end: "42557344", g1name: "EML4", g2chr: "2", g2start: "29416093", g2end: "30143525", g2name: "ALK"},
  {fusion: "ABL1--BCR", g1chr: "9", g1start: "133589707", g1end: "133761067", g1name: "ABL1", g2chr: "22", g2start: "23523148", g2end: "23657706", g2name: "BCR"},
]];
(2) Including LINK data
Use <script> tag to include LINK01.js.
<script src="../data/LINK01.js"></script>
(3) Initialize BioCircos.js with LINK data
Prepare a <div> tag with “example” id to set the picture position your will draw in html, e.g.:
BioCircos01 = new BioCircos(LINK01,BioCircosGenome,{ // Initialize with "LINK01" data tag
(4) Visualization of LINK data using BioCircos.js
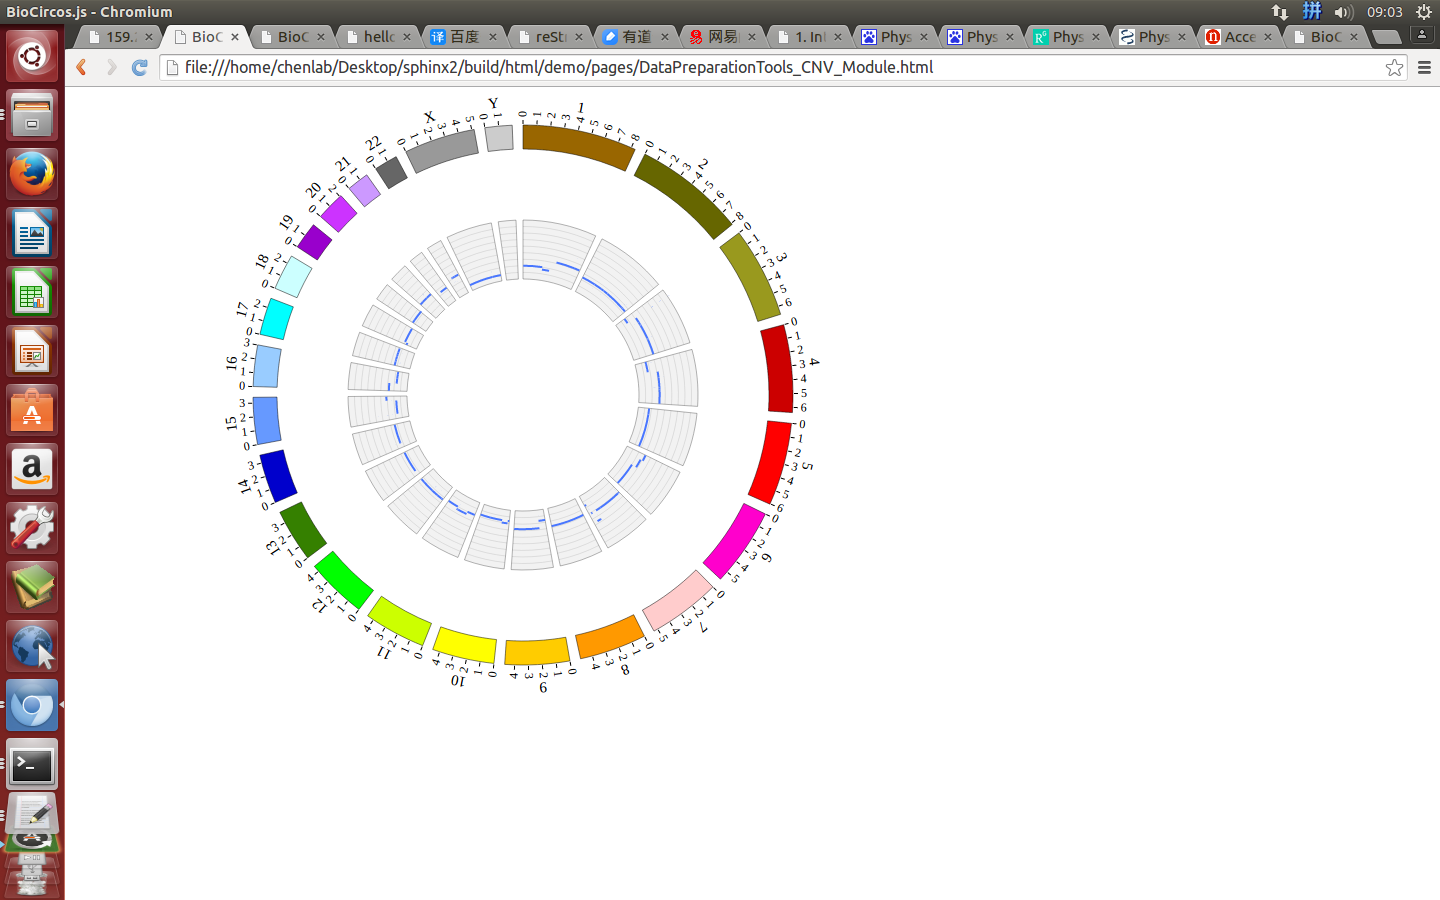
4.5 CNV module
“CNV module” is used to display the CNV data, etc. Of course, other data have similar structure can also be displayed by CNV module.
Note
We will use four steps to illustrate the input data preparation and how to use CNV module, below is an example.
(1) CNV data preparation
Input data
Users should prepare the input data in the following format (separated by tabs).
#chr    start   end     value
1       764788  87109267        2.5
1       87109268        120217058       2
1       144101324       222713034       4
1       222713035       222867750       6
......
9       30330084        140139368       3.5
X       105073  114046817       1
X       114112404       114299959       2
X       114376344       154884814       1
Four fields are required:
- The 1 column(
chr) is the name of the chromosome. - The 2 column(
start) is the start of the CNV region. - The 3 column(
end) is the end of the CNV region. - The 4 column(
value) is the copy number of CNV region.
Save the input data to “CNV01.txt”, Use “Biocircos_PrepareData.py” to prepare data
python Biocircos_PrepareData.py CNV CNV01.txt > CNV01.js
Output data used in BioCircos.js
Change the default configuration, and finally CNV01.js is in the following:
var CNV01 = [ "CNV01" , {
  maxRadius: 175,
  minRadius: 116,
  CNVwidth: 2,
  CNVColor: "#4876FF",
} , [
  {chr: "1", start: "764788", end: "87109267", value: "2.5"},
  {chr: "1", start: "87109268", end: "120217058", value: "2"},
  {chr: "1", start: "144101324", end: "222713034", value: "4"},
  {chr: "1", start: "222713035", end: "222867750", value: "6"},
  ......
  {chr: "9", start: "30330084", end: "140139368", value: "3.5"},
  {chr: "X", start: "105073", end: "114046817", value: "1"},
  {chr: "X", start: "114112404", end: "114299959", value: "2"},
  {chr: "X", start: "114376344", end: "154884814", value: "1"},
]];
(2) Including CNV data
Use <script> tag to include CNV01.js.
<script src="../data/data_prepare/CNV01.js"></script>
(3) Initialize CNV data with data tag : CNV01
Here the data’s data tag is defined as CNV01.
BioCircos01 = new BioCircos(BACKGROUND01,CNV01,BioCircosGenome,{ // Initialize with "CNV01" data tag
(4) Visualization of CNV data using BioCircos.js
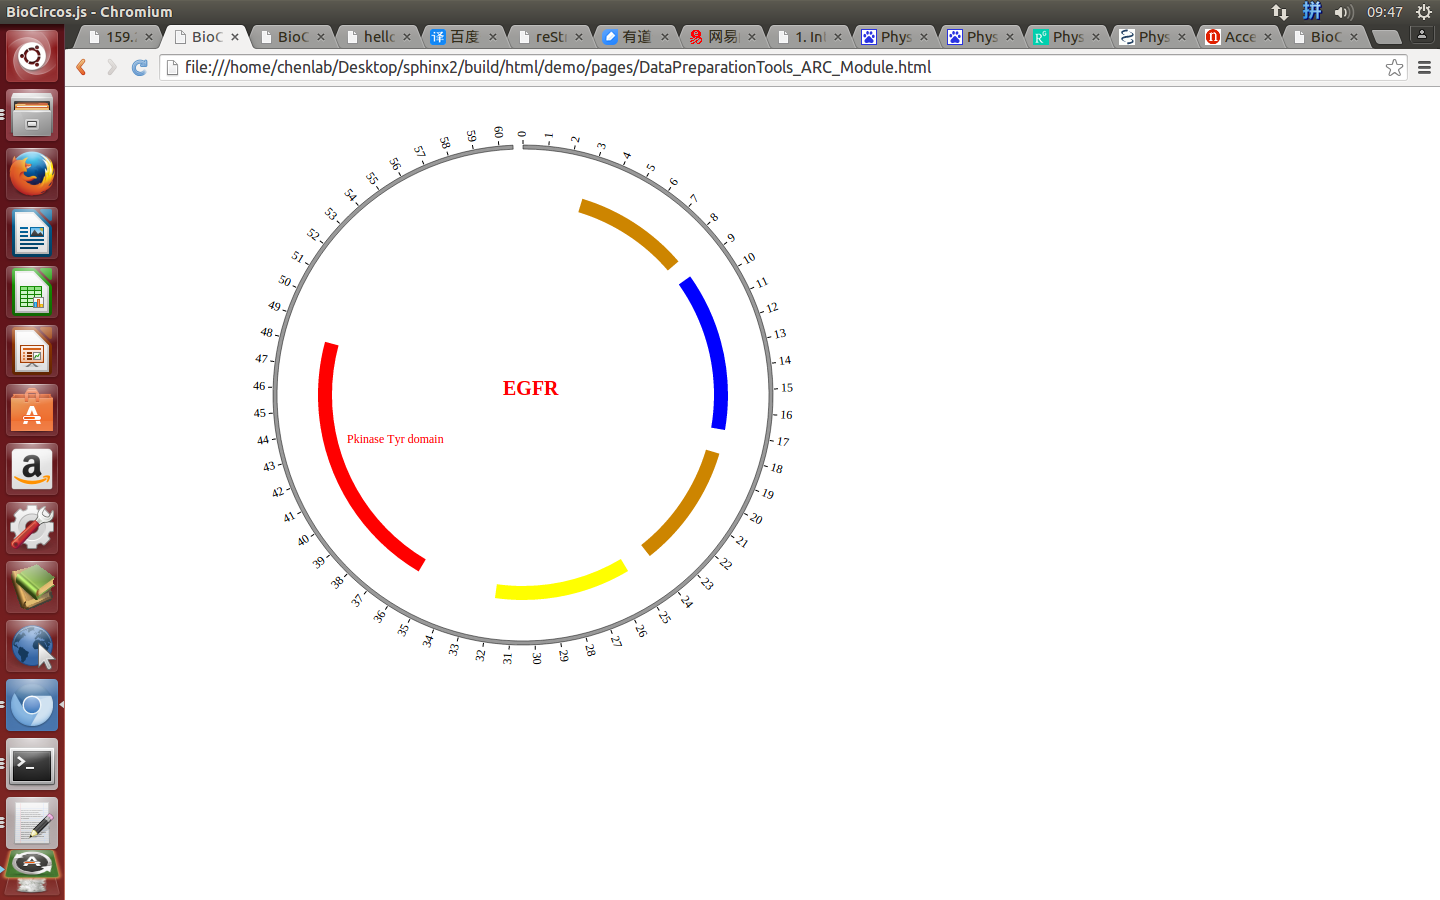
4.6 ARC module
“ARC module” is used to display the CNV without value, Gene domain, Chromosome band, etc. Of course, other data have similar structure can also be displayed by ARC module.
Note
We will use four steps to illustrate the input data preparation and how to use ARC module, below is an example.
(1) ARC data preparation
Input data
Users should prepare the input data in the following format (separated by tabs).
#chr    start   end     color   des
EGFR    57      167     #CD8500 Recep_L domain
EGFR    185     338     blue    Furin-like domain
EGFR    361     480     #CD8500 Recep_L domain
EGFR    505     636     yellow  GF_recep_IV domain
EGFR    713     965     red     Pkinase Tyr domain
Five fields are required:
- The 1 column(
chr) is the name of the chromosome. In this example, this field specify the protein name. - The 2 column(
start) is the start of the arc. - The 3 column(
end) is the end of the arc. - The 4 column(
color) is the color of the arc. - The 5 column(
des) is the description of the arc.
Save the input data to “ARC01.txt”, Use “Biocircos_PrepareData.py” to prepare data
python Biocircos_PrepareData.py ARC ARC01.txt > ARC01.js
Output data used in BioCircos.js
Change the default configuration, and finally ARC01.js is in the following:
var ARC01 = [ "ARC01" , {
  innerRadius: -55,
  outerRadius: -45,
} , [
  {chr: "EGFR", start: "57", end: "167", color: "#CD8500", des: "Recep_L domain"},
  {chr: "EGFR", start: "185", end: "338", color: "blue", des: "Furin-like domain"},
  {chr: "EGFR", start: "361", end: "480", color: "#CD8500", des: "Recep_L domain"},
  {chr: "EGFR", start: "505", end: "636", color: "yellow", des: "GF_recep_IV domain"},
  {chr: "EGFR", start: "713", end: "965", color: "red", des: "Pkinase Tyr domain"},
]];
(2) Including ARC data
Use <script> tag to include ARC01.js.
<script src="../data/data_prepare/ARC01.js"></script>
(3) Initialize ARC data with data tag : ARC01
Here the data’s data tag is defined as ARC01.
BioCircos01 = new BioCircos(TEXT01,ARC01,BioCircosGenome,{ // Initialize with "ARC01" data tag
(4) Visualization of ARC module using BioCircos.js
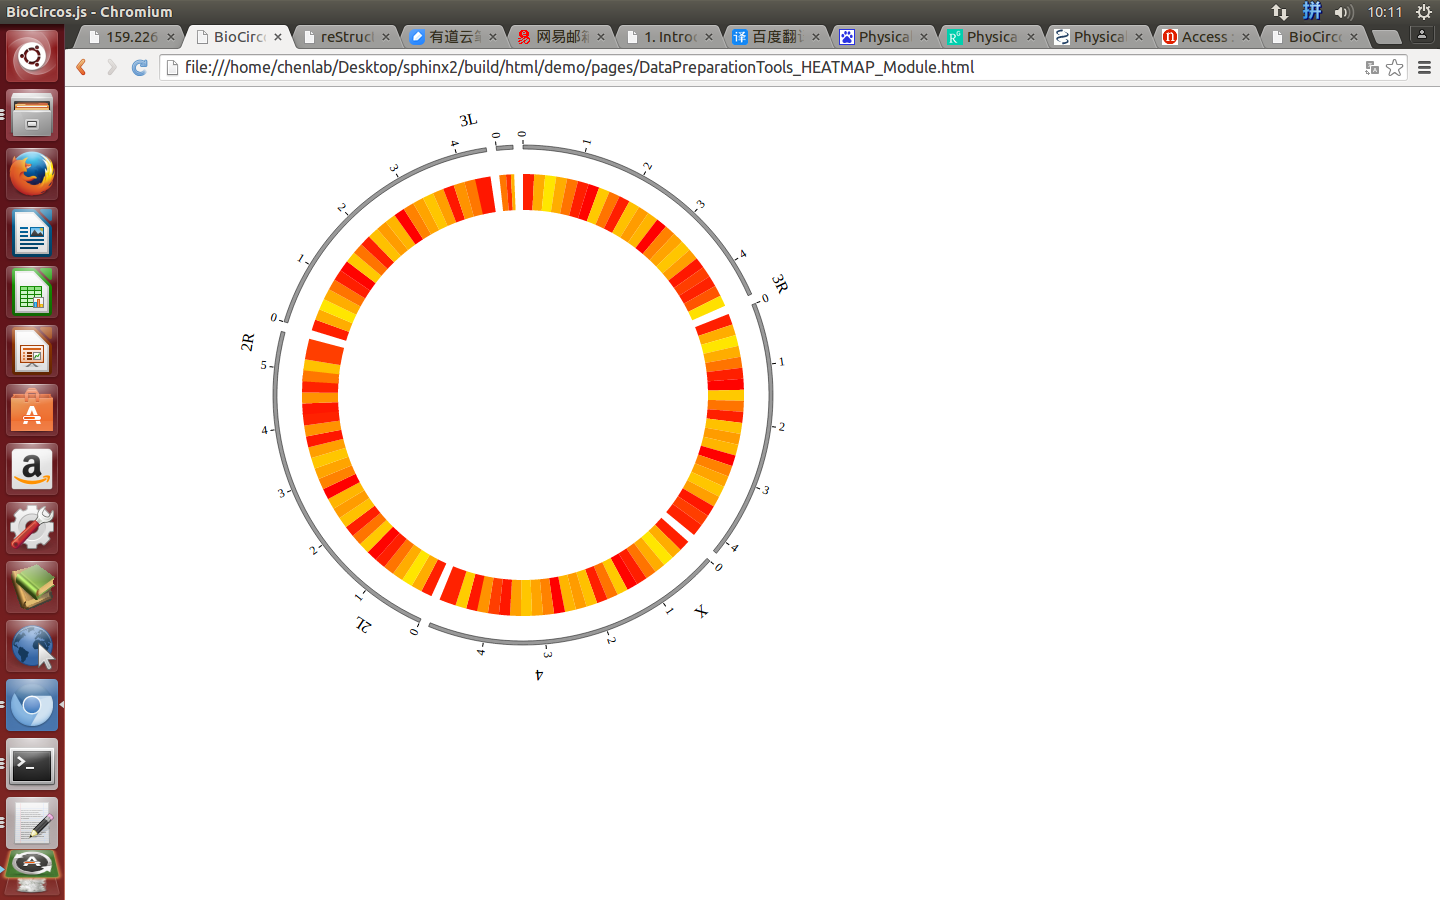
4.7 HEATMAP module
“HEATMAP module” is used to display the Gene expression data, etc. Of course, other data have similar structure can also be displayed by HEATMAP module.
Note
We will use four steps to illustrate the input data preparation and how to use HEATMAP module, below is an example.
- Input data: HEATMAP01.txt
- Input data used in BioCircos.js: HEATMAP01.js
(1) HEATMAP data preparation
Input data
Users should prepare the input data in the following format (separated by tabs).
#chr    start   end     name    value
2L      1       1011544 test heatmap    0.8
2L      1011548 2011544 test heatmap    0.3
2L      2011548 3011544 test heatmap    0.1
2L      2011545 2011546 test heatmap    0.01
......
X       18011548        19011544        test heatmap    0.83
X       19011548        20011544        test heatmap    0.39
X       20011548        21146708        test heatmap    0.49
X       21011548        22422827        test heatmap    0.83
Five fields are required:
- The 1 column(
chr) is the name of the chromosome. - The 2 column(
start) is the start of the region. - The 3 column(
end) is the end of the region. - The 4 column(
name) is the name of the region. - The 5 column(
value) is the value of the region.
Save the input data to “HEATMAP01.txt”, Use “Biocircos_PrepareData.py” to prepare data
python Biocircos_PrepareData.py HEATMAP HEATMAP01.txt > HEATMAP01.js
Output data used in BioCircos.js
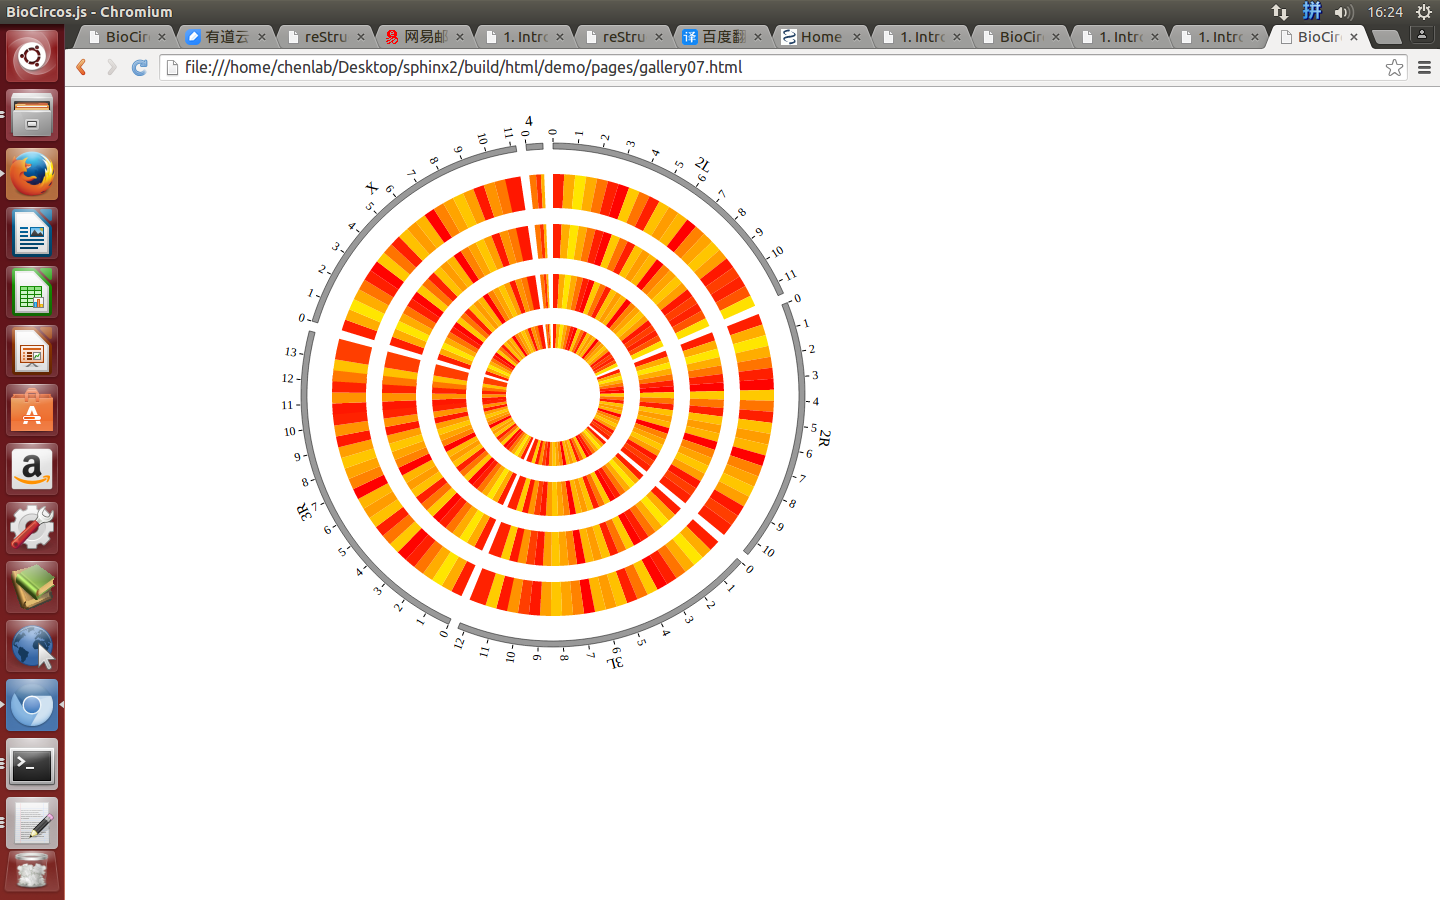
Change the default configuration, and finally HEATMAP01.js is in the following:
var HEATMAP01 = [ "HEATMAP01" , {
  innerRadius: -25,
  outerRadius: -65,
  maxColor: "red",
  minColor: "yellow"
} , [
  {chr: "2L", start: "1", end: "1011544", name: "test heatmap", value: "0.8"},
  {chr: "2L", start: "1011548", end: "2011544", name: "test heatmap", value: "0.3"},
  {chr: "2L", start: "2011548", end: "3011544", name: "test heatmap", value: "0.1"},
  {chr: "2L", start: "2011545", end: "2011546", name: "test heatmap", value: "0.01"},
......
  {chr: "X", start: "18011548", end: "19011544", name: "test heatmap", value: "0.83"},
  {chr: "X", start: "19011548", end: "20011544", name: "test heatmap", value: "0.39"},
  {chr: "X", start: "20011548", end: "21146708", name: "test heatmap", value: "0.49"},
  {chr: "X", start: "21011548", end: "22422827", name: "test heatmap", value: "0.83"},
]];
(2) Including HEATMAP data
Use <script> tag to include HEATMAP01.js.
<script src="../data/data_prepare/HEATMAP01.js"></script>
(3) Initialize HEATMAP data with data tag : HEATMAP01
Here the data’s data tag is defined as HEATMAP01.
BioCircos01 = new BioCircos(HEATMAP01,BioCircosGenome,{ // Initialize with "HEATMAP01" data tag
(4) Visualization of HEATMAP data using BioCircos.js
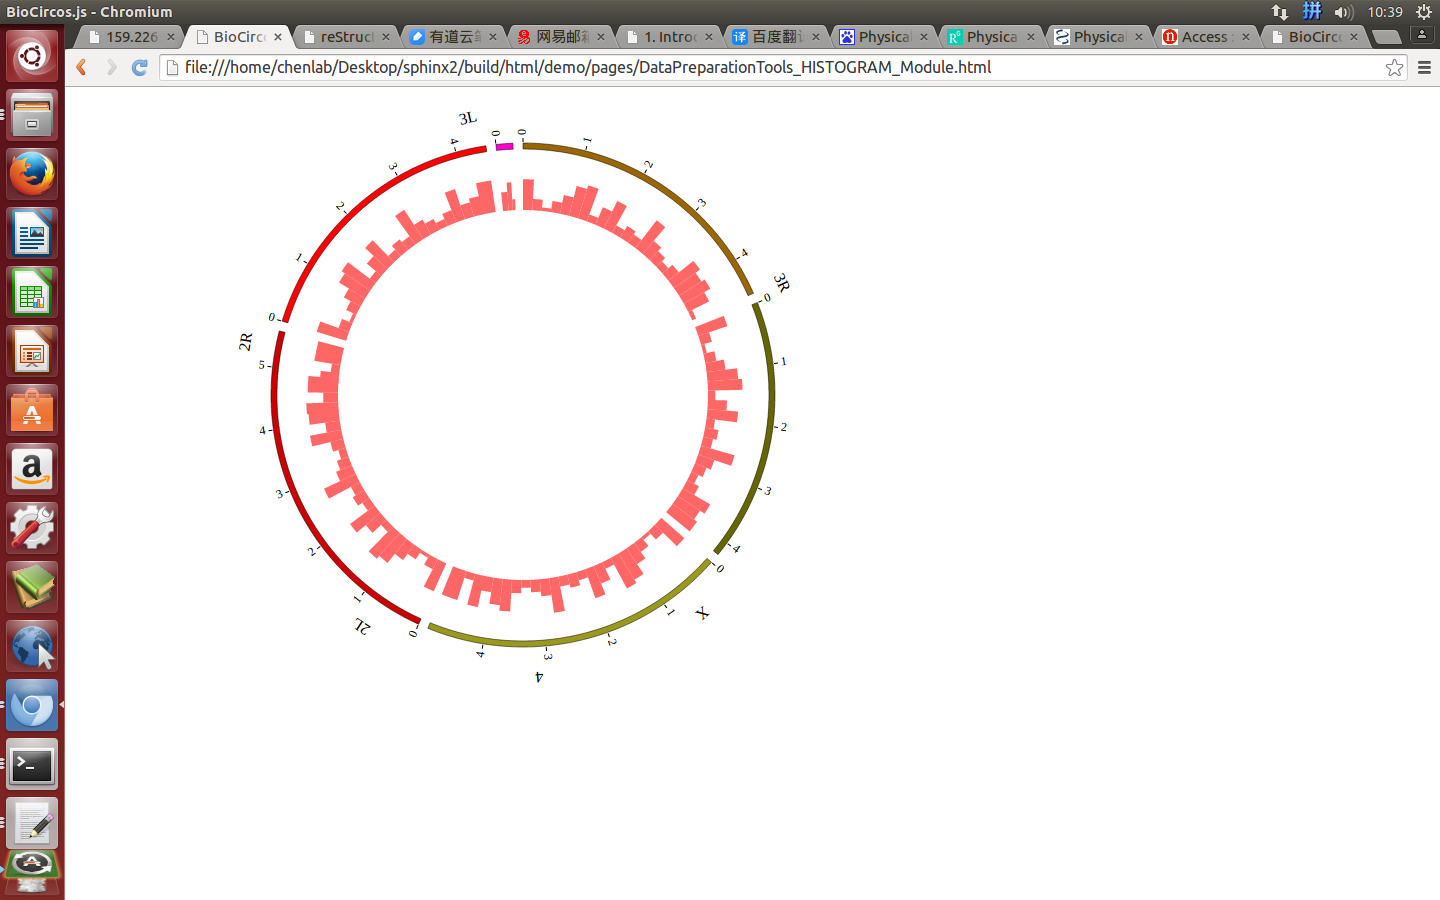
4.8 HISTOGRAM module
“HISTOGRAM module” is used to display the Gene expression data, etc. Of course, other data have similar structure can also be displayed by HISTOGRAM module.
Note
We will use four steps to illustrate the input data preparation and how to use HISTOGRAM module, below is an example.
- Input data: HISTOGRAM01.txt
- Input data used in BioCircos.js: HISTOGRAM01.js
(1) HISTOGRAM data preparation
Input data
Users should prepare the input data in the following format (separated by tabs).
#chr    start   end     name    value
2L      1       1011544 test histogram  0.8
2L      1011548 2011544 test histogram  0.3
2L      2011548 3011544 test histogram  0.1
2L      2011545 2011546 test histogram  0.01
......
X       18011548        19011544        test histogram  0.83
X       19011548        20011544        test histogram  0.39
X       20011548        21146708        test histogram  0.49
X       21011548        22422827        test histogram  0.83
Five fields are required:
- The 1 column(
chr) is the name of the chromosome. - The 2 column(
start) is the start of the region. - The 3 column(
end) is the end of the region. - The 4 column(
name) is the name of the region. - The 5 column(
value) is the value of the region.
Save the input data to “HISTOGRAM01.txt”, Use “Biocircos_PrepareData.py” to prepare data
python Biocircos_PrepareData.py HISTOGRAM HISTOGRAM01.txt > HISTOGRAM01.js
Output data used in BioCircos.js
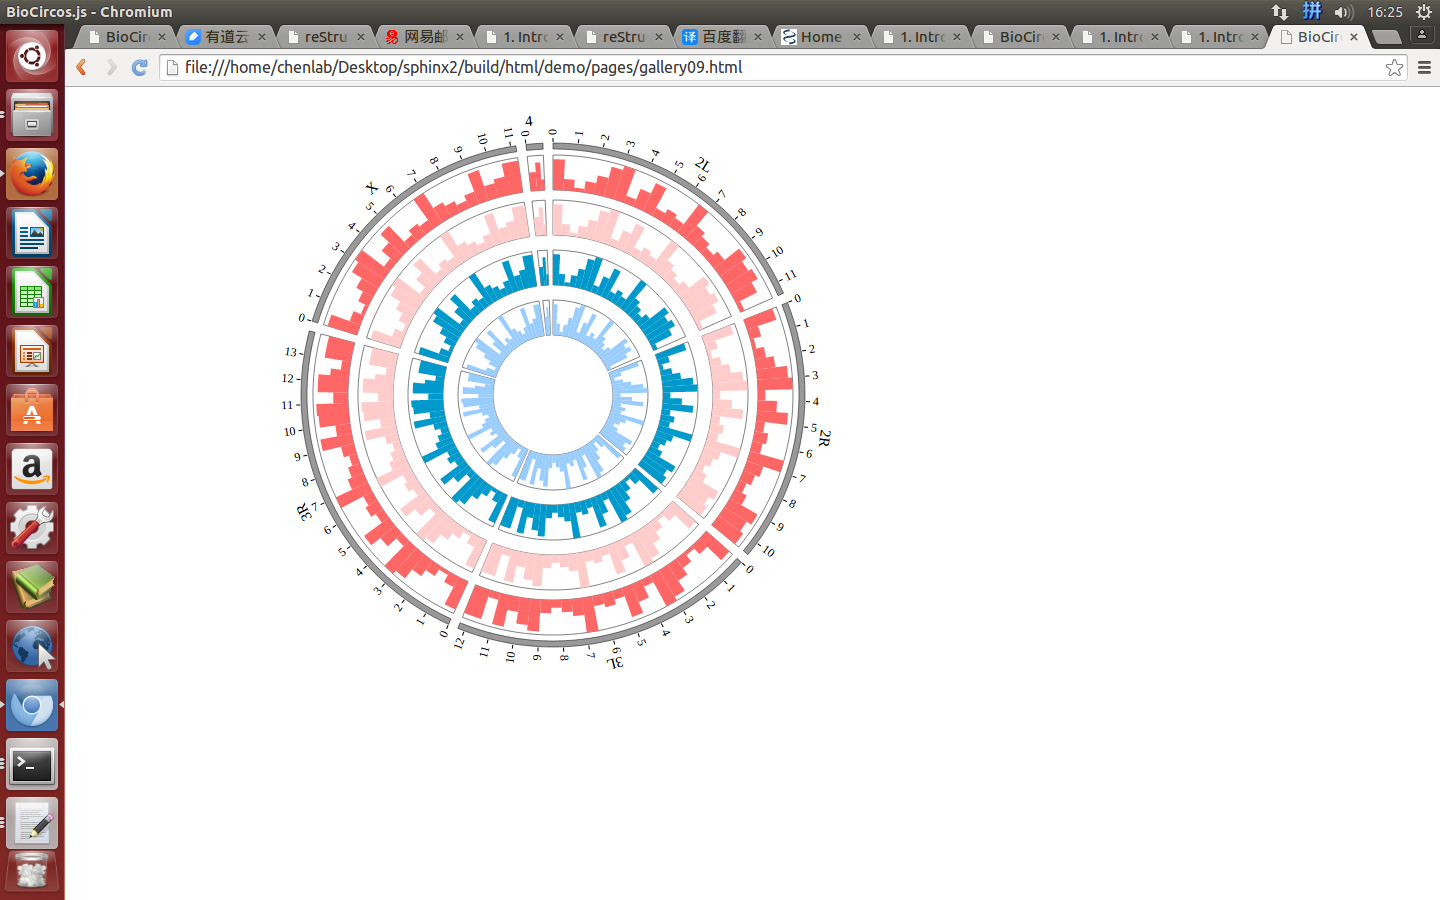
Change the default configuration, and finally HISTOGRAM01.js is in the following:
var HISTOGRAM01 = [ "HISTOGRAM01" , {
  maxRadius: 220,
  minRadius: 185,
  histogramFillColor: "#FF6666",
} , [
  {chr: "2L", start: "1", end: "1011544", name: "test histogram", value: "0.8"},
  {chr: "2L", start: "1011548", end: "2011544", name: "test histogram", value: "0.3"},
  {chr: "2L", start: "2011548", end: "3011544", name: "test histogram", value: "0.1"},
  {chr: "2L", start: "2011545", end: "2011546", name: "test histogram", value: "0.01"},
  ......
  {chr: "X", start: "18011548", end: "19011544", name: "test histogram", value: "0.83"},
  {chr: "X", start: "19011548", end: "20011544", name: "test histogram", value: "0.39"},
  {chr: "X", start: "20011548", end: "21146708", name: "test histogram", value: "0.49"},
  {chr: "X", start: "21011548", end: "22422827", name: "test histogram", value: "0.83"},
]];
(2) Including HISTOGRAM data
Use <script> tag to include HISTOGRAM01.js.
<script src="../data/data_prepare/HISTOGRAM01.js"></script>
(3) Initialize HISTOGRAM data with data tag : HISTOGRAM01
Here the data’s data tag is defined as HISTOGRAM01.
BioCircos01 = new BioCircos(HISTOGRAM01,BioCircosGenome,{ // Initialize with "HISTOGRAM01" data tag
(4) Visualization of HISTOGRAM data using BioCircos.js
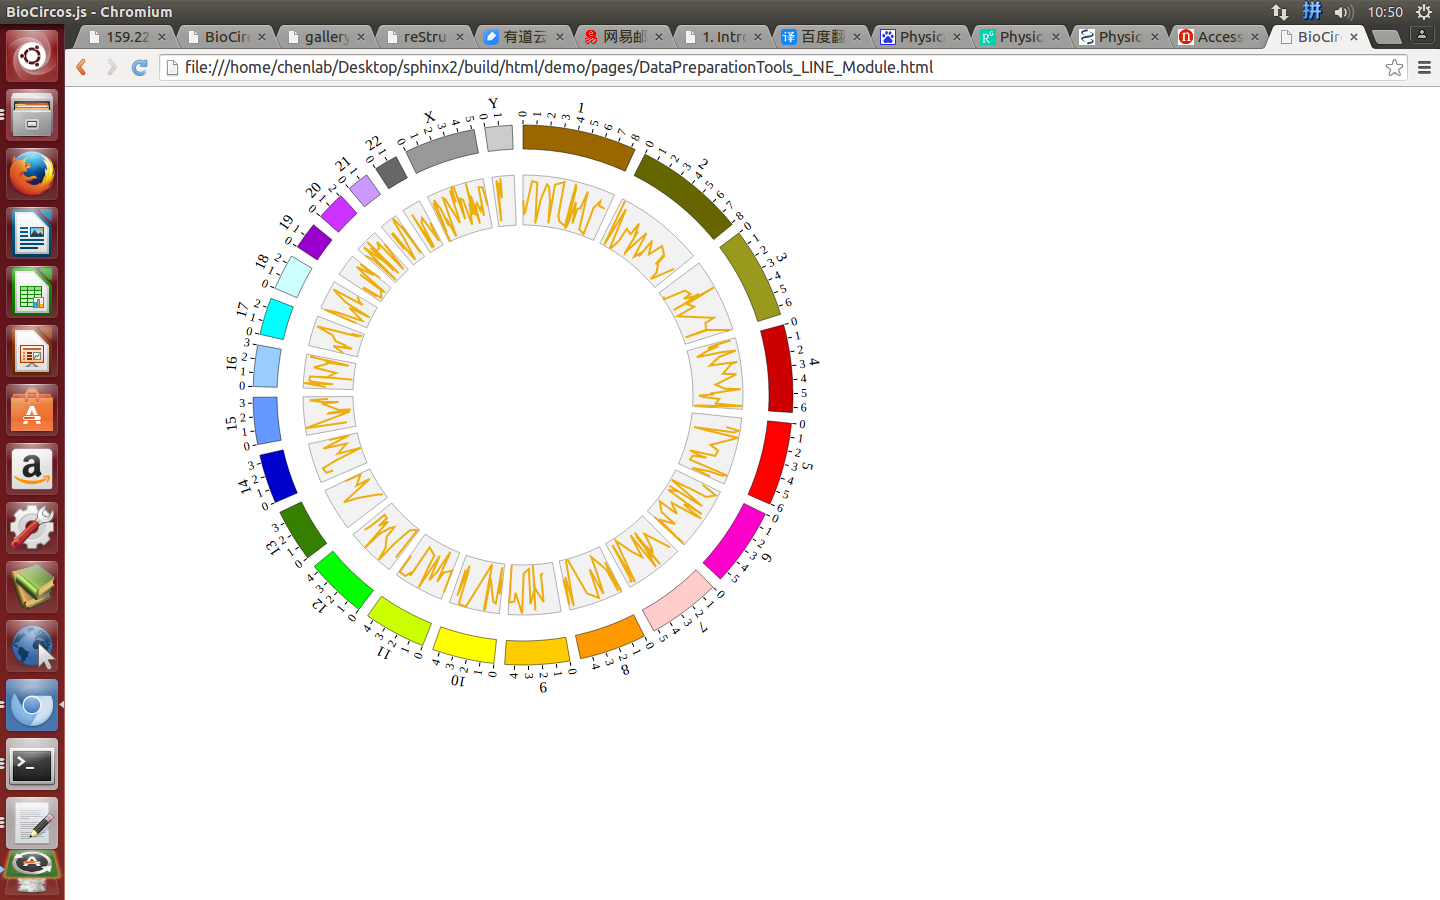
4.9 LINE module
“LINE module” is used to display the Gene expression data, etc. Of course, other data have similar structure can also be displayed by LINE module.
Note
We will use four steps to illustrate the input data preparation and how to use LINE module, below is an example.
- Input data: LINE01.txt
- Input data used in BioCircos.js: LINE01.js
(1) LINE data preparation
Input data
Users should prepare the input data in the following format (separated by tabs).
#chr    pos     value
1       813468  0.5
1       3383745 0.22385
1       6157646 0.238643
1       24793116        0.876947
......
X       136860114       0.267261
X       138413104       0.847613
X       149344414       0.830811
X       154203563       0.43466
Three fields are required:
- The 1 column(
chr) is the name of the chromosome. - The 2 column(
pos) is the position of the point. - The 3 column(
value) is the value of the point.
Save the input data to “LINE01.txt”, Use “Biocircos_PrepareData.py” to prepare data
python Biocircos_PrepareData.py LINE LINE01.txt > LINE01.js
Output data used in BioCircos.js
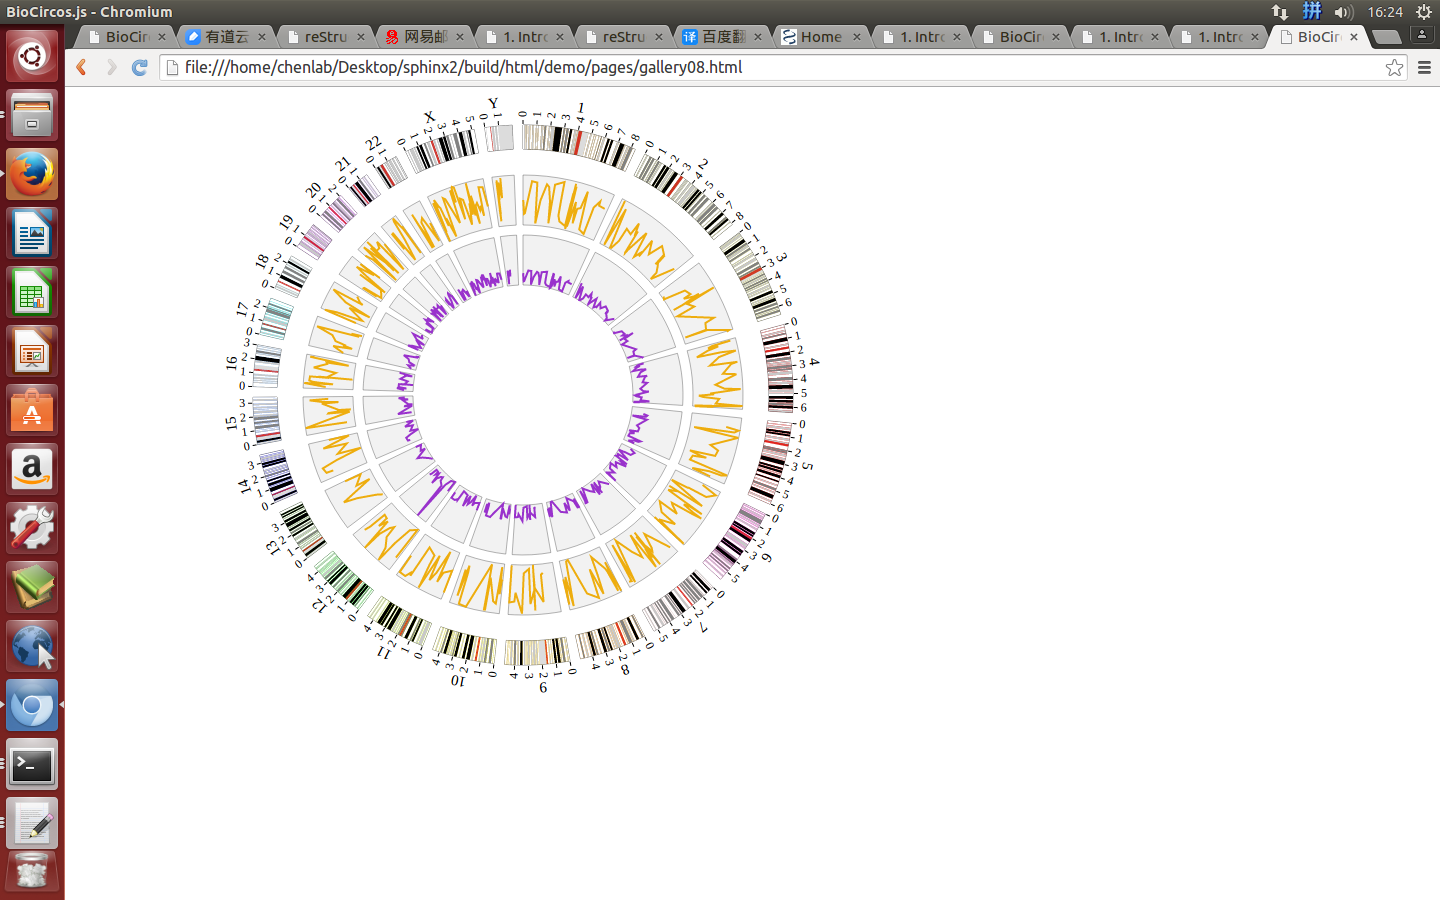
Change the default configuration, and finally LINE01.js is in the following:
var LINE01 = [ "LINE01" , {
  maxRadius: 220,
  minRadius: 170,
  LineColor: "#EEAD0E",
  LineWidth: 2,
} , [
  {chr: "1", pos: "813468", value: "0.5"},
  {chr: "1", pos: "3383745", value: "0.22385"},
  {chr: "1", pos: "6157646", value: "0.238643"},
  {chr: "1", pos: "24793116", value: "0.876947"},
  ......
  {chr: "X", pos: "136860114", value: "0.267261"},
  {chr: "X", pos: "138413104", value: "0.847613"},
  {chr: "X", pos: "149344414", value: "0.830811"},
  {chr: "X", pos: "154203563", value: "0.43466"},
]];
(2) Including LINE data
Use <script> tag to include LINE01.js.
<script src="../data/LINE01.js"></script>
(3) Initialize LINE data with data tag : LINE01
Here the data’s data tag is defined as LINE01.
BioCircos01 = new BioCircos(BACKGROUND01,LINE01,BioCircosGenome,{ // Initialize with "LINE01" data tag
(4) Visualization of LINE data using BioCircos.js
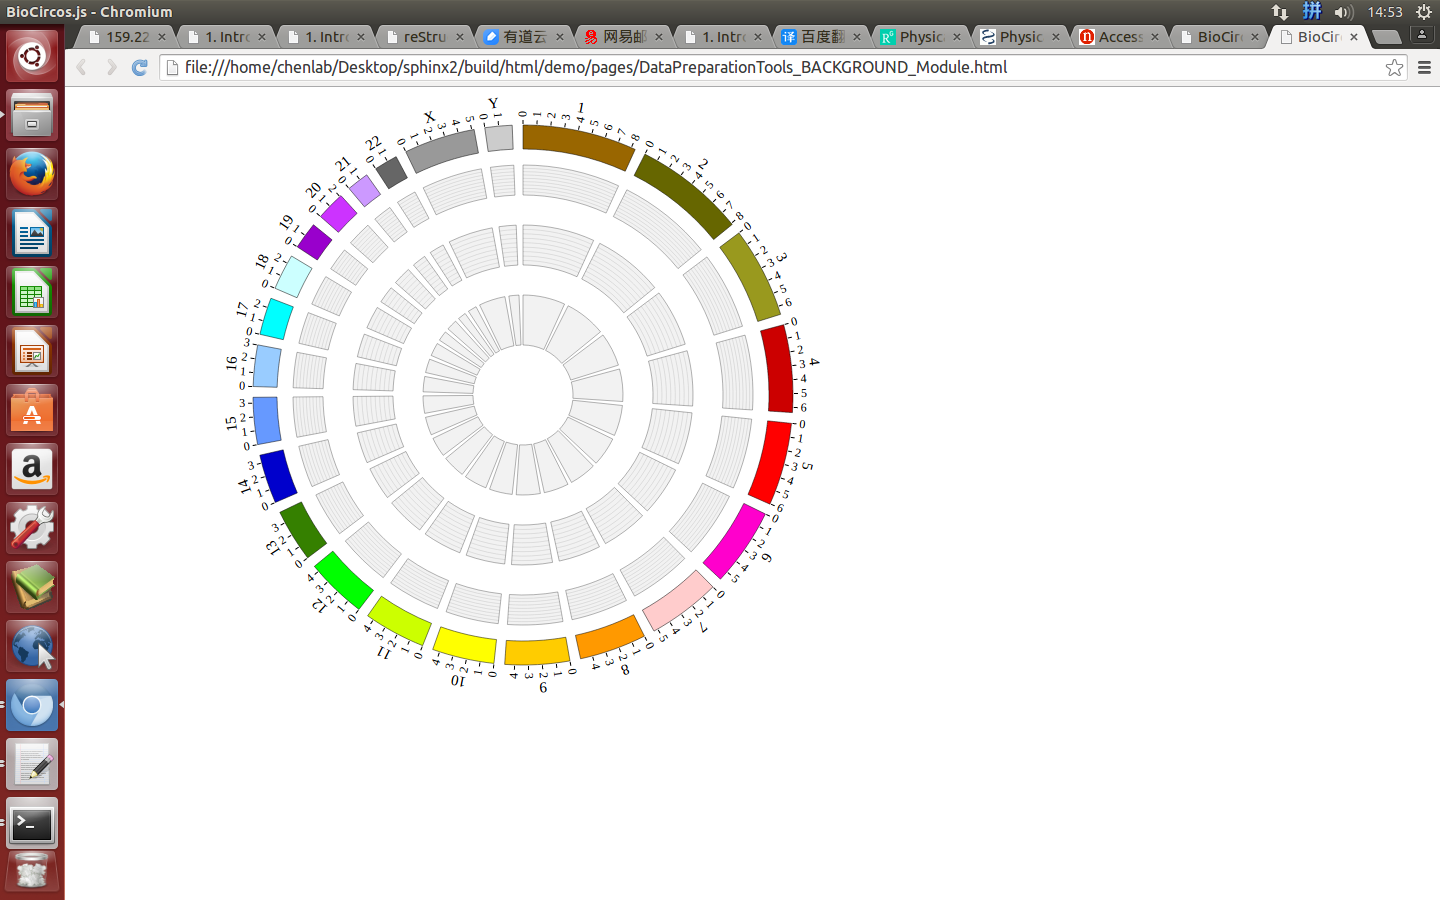
4.10 BACKGROUND module
“BACKGROUND module” is used to display background and axis circles for other modules.
Note
“BACKGROUND module” has no data entry, only the configuration parameters. We will illustrate how to use BACKGROUND module, below is an example.
(1) Including BACKGROUND configuration
Use <script> tag to include BACKGROUND01, BACKGROUND02, BACKGROUND03.
<!-- Data configuration -->
<script>
var BACKGROUND01 = [ "BACKGROUND01" , {
  BginnerRadius: 230,
  BgouterRadius: 200,
  BgFillColor: "#F2F2F2",
  BgborderColor : "#000",
  BgborderSize : 0.3,
  axisShow: "true",
  axisWidth: 0.1,
  axisColor: "#000",
  axisNum: 8
}];
var BACKGROUND02 = [ "BACKGROUND02" , {
  BginnerRadius: 170,
  BgouterRadius: 130,
  BgFillColor: "#F2F2F2",
  BgborderColor : "#000",
  BgborderSize : 0.3,
  axisShow: "true",
  axisWidth: 0.1,
  axisColor: "#000",
  axisNum: 8
}];
var BACKGROUND03 = [ "BACKGROUND03" , {
  BginnerRadius: 100,
  BgouterRadius: 50,
  BgFillColor: "#F2F2F2",
  BgborderColor : "#000",
  BgborderSize : 0.3,
  axisShow: "false",
  axisWidth: 0.1,
  axisColor: "#000",
  axisNum: 8
}];
</script>
(2) Initialize BACKGROUND configuration with data tag : BACKGROUND01, BACKGROUND02, BACKGROUND03
Here the data’s data tag is defined as BACKGROUND01, BACKGROUND02 and BACKGROUND03.
BioCircos01 = new BioCircos(BACKGROUND01,BACKGROUND02,BACKGROUND03,BioCircosGenome,{ // Initialize with data tag
(3) Visualization of BACKGROUND module using BioCircos.js
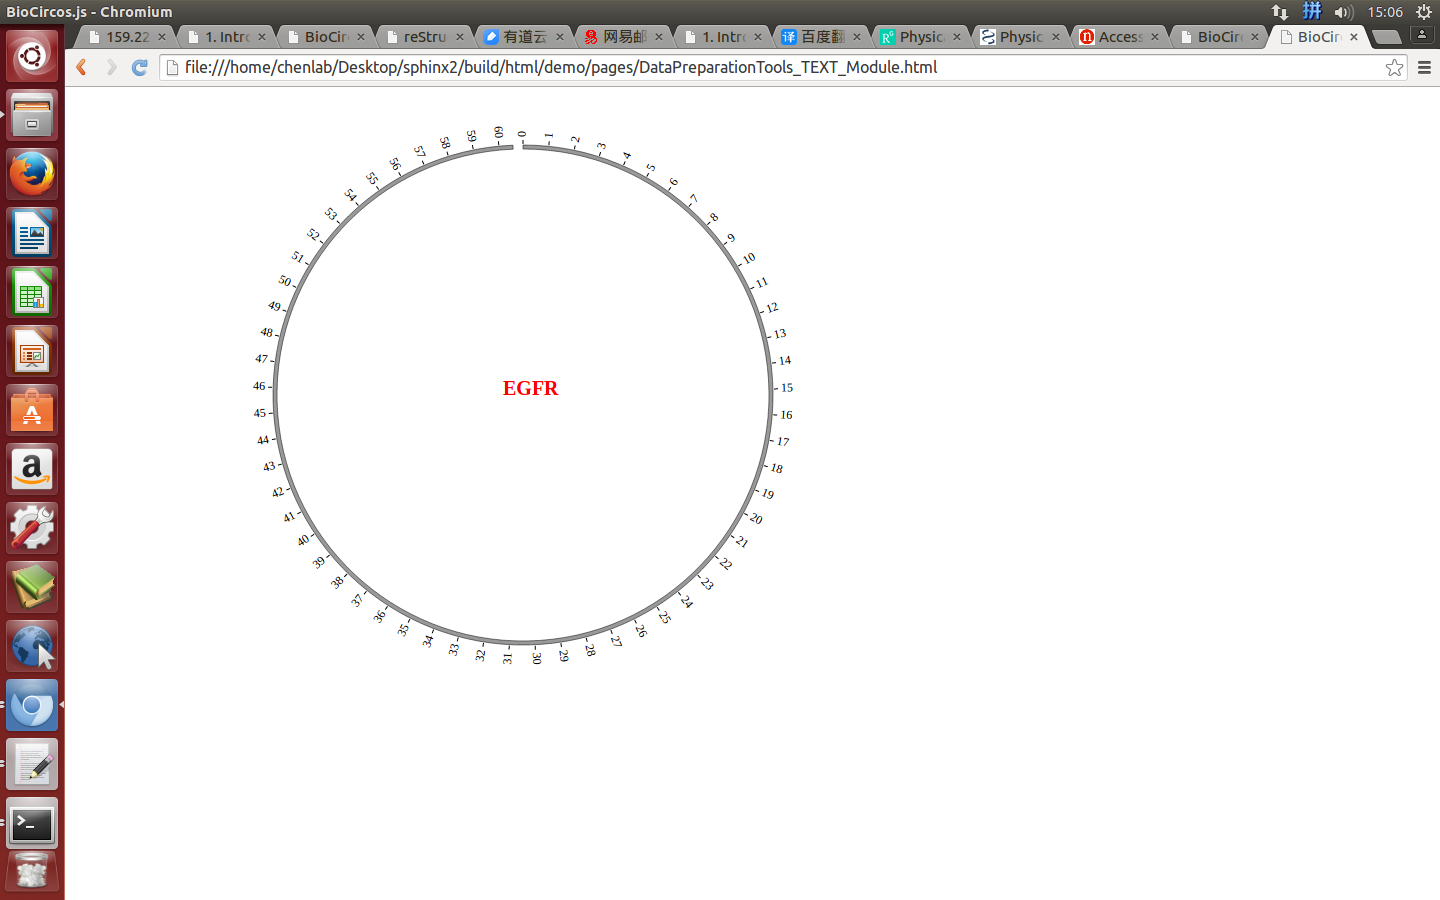
4.11 TEXT module
“TEXT module” is used to display annotation text at specific elements.
Note
“TEXT module” has no data entry, only the configuration parameters. We will illustrate how to use TEXT module, below is an example.
(1) Including TEXT configuration
Use <script> tag to include TEXT01.
<!-- Data configuration -->
<script>
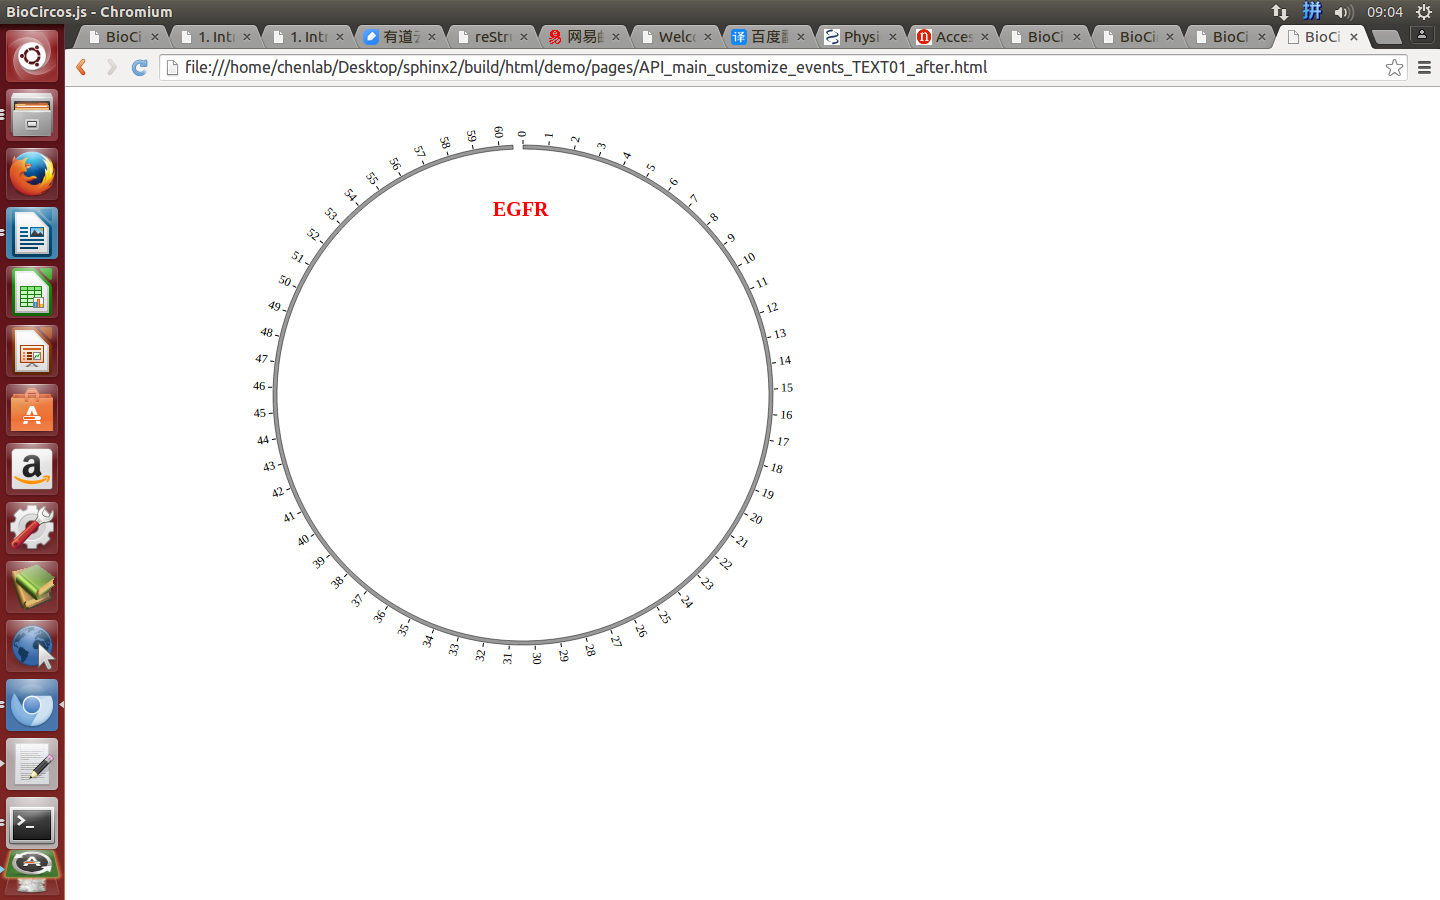
var TEXT01 = [ "TEXT01" , {
x: -20,
y: 0,
textSize: 20,
textWeight: "bold",
textColor: "red",
textOpacity: 1.0,
text: "EGFR"
}];
</script>
(2) Initialize TEXT configuration with data tag : TEXT01
Here the data’s data tag is defined as TEXT01.
BioCircos01 = new BioCircos(TEXT01,BioCircosGenome,{ // Initialize with "TEXT01" data tag
(3) Visualization of TEXT module using BioCircos.js
5. API: Main configuration
“Main configuration” is the main configuration part of BioCircos.js and mainly divided into four classes: “Customize SVG”, “Customize genome”, “Customize Events” and “Customize Tooltips”.
| Class of Main configuration | Major function |
|---|---|
| Customize SVG | Customize the length, width and position of the canvas(SVG)... |
| Customize genome | Customize the wtidth and color of the genome; Customize the attributes of the ticks; Customize the attributes of the genome labels... |
| Customize Events | Customize text drag event, zoom translation event and mouse binding event... |
| Customize Tooltips | Customize content and style of tooltips... |
5.1 Customize SVG
Customize SVG class is used to customize the length, width and position of the canvas(SVG).
(1)All configuration parameters
Here we show all the configuration parameters in Customize SVG class.
BioCircos01 = new BioCircos(BioCircosGenome,{
   // Main configuration - Customize SVG
   target : "biocircos",
   svgWidth : 900,
   svgHeight : 600,
});
(2)Configuration and examples
targetdefault “biocircos”, SVG position in html, where <div> id is “biocircos”
svgWidthdefault 900, SVG width
svgHeightdefault 600, SVG height
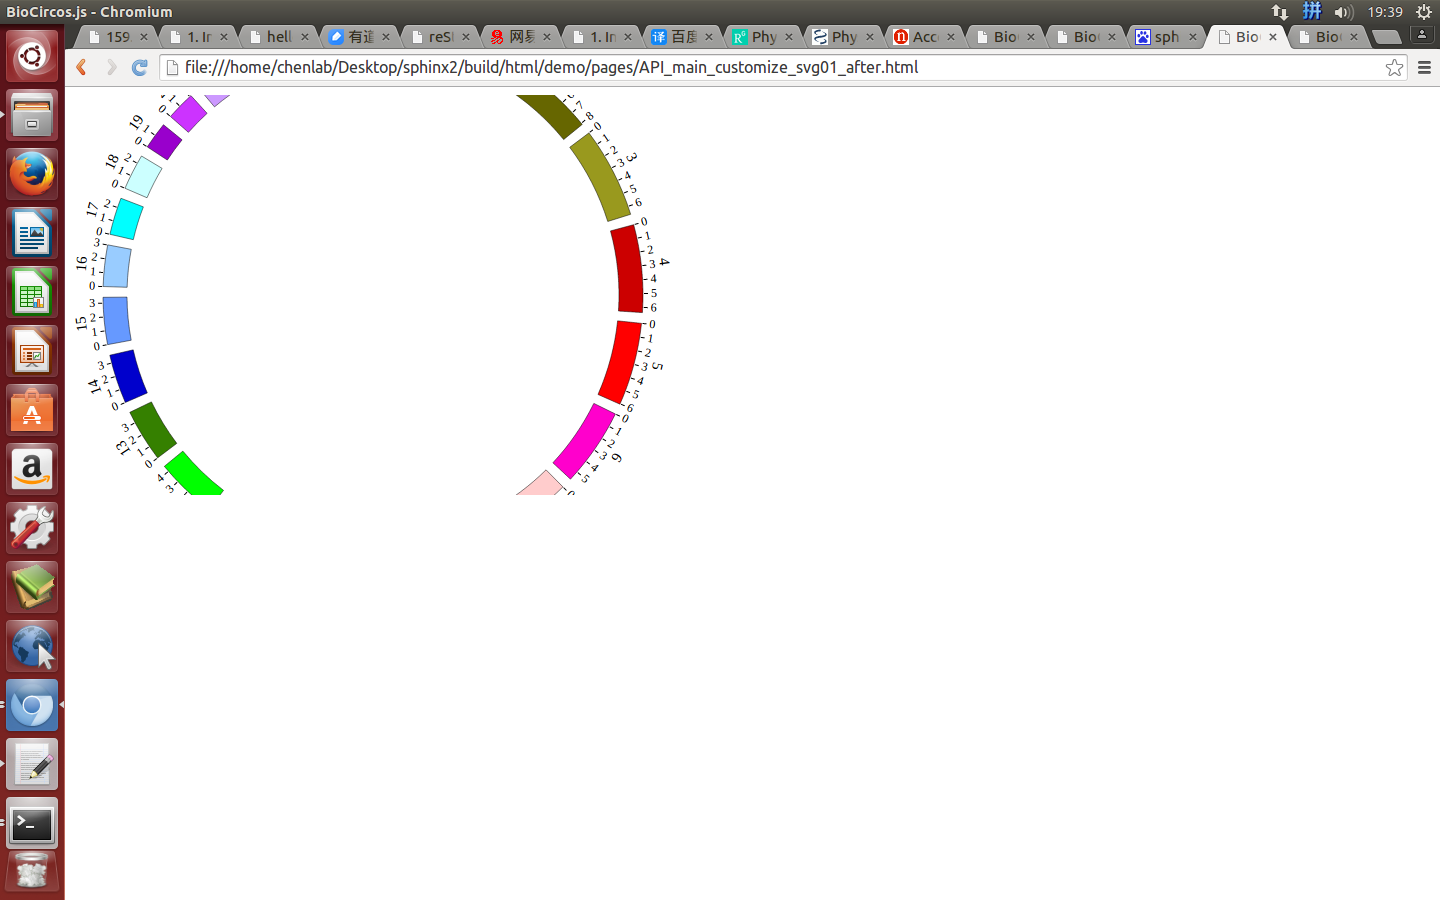
Example: change the size of SVG
| Example | Before | After |
|---|---|---|
| Code change | svgWidth : 900,
svgHeight : 600,
|
svgWidth : 600,
svgHeight : 400,
|
| Image change | 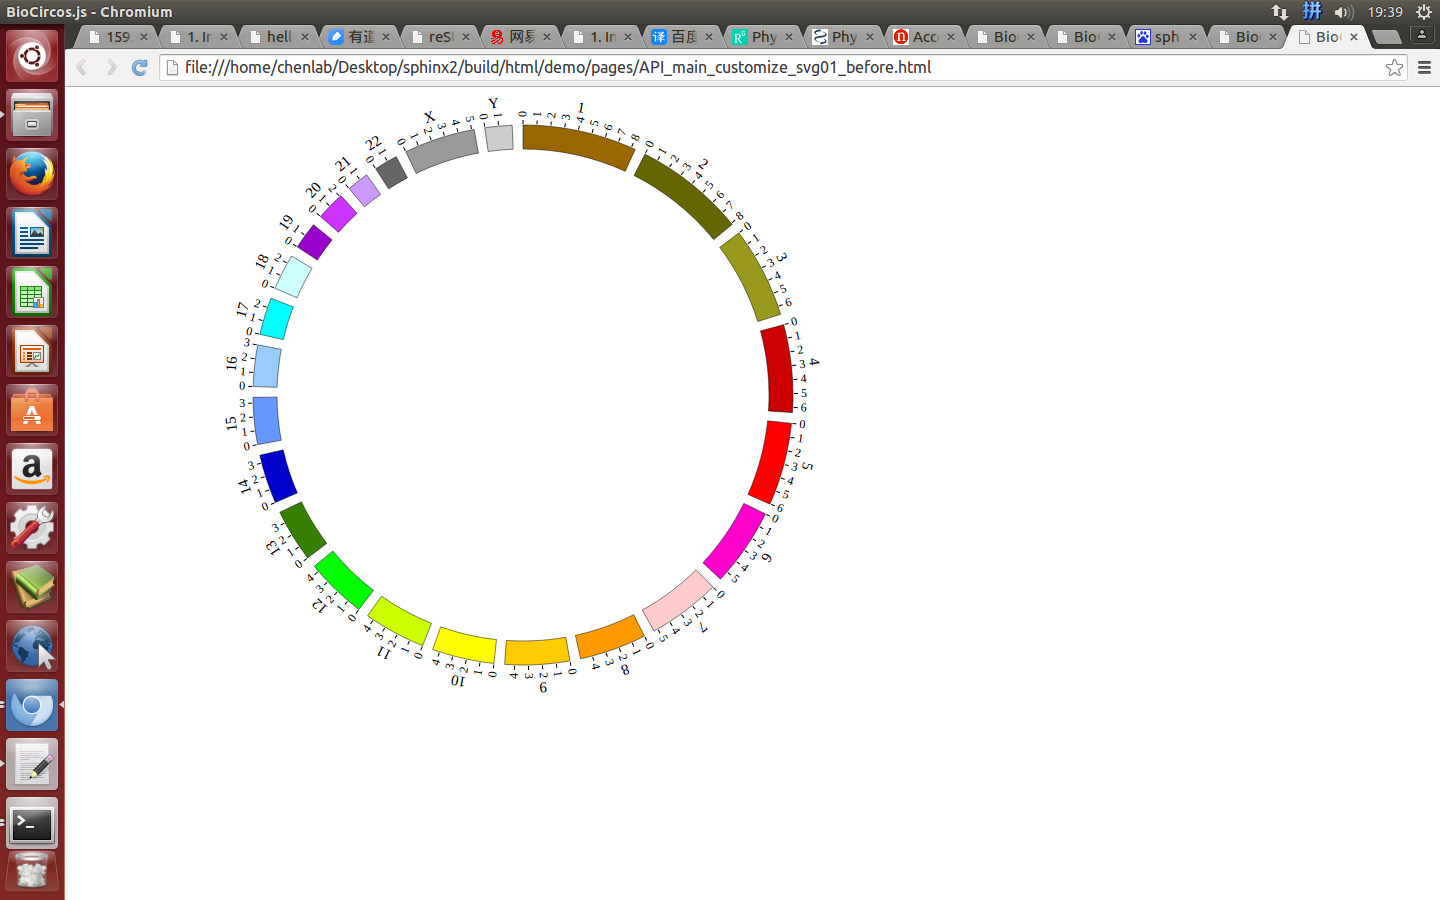
|
|
5.2 Customize genome
Customize genome class is used to customize the wtidth and color of the genome, the attributes of the ticks and the attributes of the genome labels.
(1)All configuration parameters
Here we show all the configuration parameters in Customize genome class.
BioCircos01 = new BioCircos(BioCircosGenome,{
   // Main configuration - Customize genome
   chrPad : 0.04,
   innerRadius : 246,
   outerRadius : 270,
   genomeFillColor : ["rgb(153,102,0)", "rgb(102,102,0)", "rgb(153,153,30)", "rgb(204,0,0)","rgb(255,0,0)", "rgb(255,0,204)", "rgb(255,204,204)", "rgb(255,153,0)", "rgb(255,204,0)", "rgb(255,255,0)", "rgb(204,255,0)", "rgb(0,255,0)","rgb(53,128,0)", "rgb(0,0,204)", "rgb(102,153,255)", "rgb(153,204,255)", "rgb(0,255,255)", "rgb(204,255,255)", "rgb(153,0,204)", "rgb(204,51,255)","rgb(204,153,255)", "rgb(102,102,102)", "rgb(153,153,153)", "rgb(204,204,204)"],
   genomeBorder : {
      "display" : true,
      "borderColor" : "#000",
      "borderSize" : 0.5
   },
   ticks : {
      "display" : true,
      "len" : 5,
      "color" : "#000",
      "textSize" : 10,
      "textColor" : "#000",
      "scale" : 30000000
   },
   genomeLabel : {
      "display" : true,
      "textSize" : 15,
      "textColor" : "#000",
      "dx" : 0.028,
      "dy" : "-0.55em"
   },
});
(2)Configuration and examples
chrPaddefault 0.04, distance between chromosomes
innerRadiusdefault 246, inner radius of chromosome
outerRadiusdefault 270, outer radius of chromosome
genomeFillColordefault [“rgb(153,102,0)”, “rgb(102,102,0)”, “rgb(153,153,30)”, “rgb(204,0,0)”,”rgb(255,0,0)”, “rgb(255,0,204)”, “rgb(255,204,204)”, “rgb(255,153,0)”, “rgb(255,204,0)”, “rgb(255,255,0)”, “rgb(204,255,0)”, “rgb(0,255,0)”,”rgb(53,128,0)”, “rgb(0,0,204)”, “rgb(102,153,255)”, “rgb(153,204,255)”, “rgb(0,255,255)”, “rgb(204,255,255)”, “rgb(153,0,204)”, “rgb(204,51,255)”,”rgb(204,153,255)”, “rgb(102,102,102)”, “rgb(153,153,153)”, “rgb(204,204,204)”] , an array of UCSC chromosome color
Example: change the width of genome; change distance between chromosomes; change color of chromosomes.
| Example | Before | After |
|---|---|---|
| Code change | chrPad:0.01,
innerRadius:246,
outerRadius:270,
genomeFillColor:["green", "grey"],
|
chrPad:0.05,
innerRadius:266,
outerRadius:270,
genomeFillColor:["red", "black"],
|
| Image change | 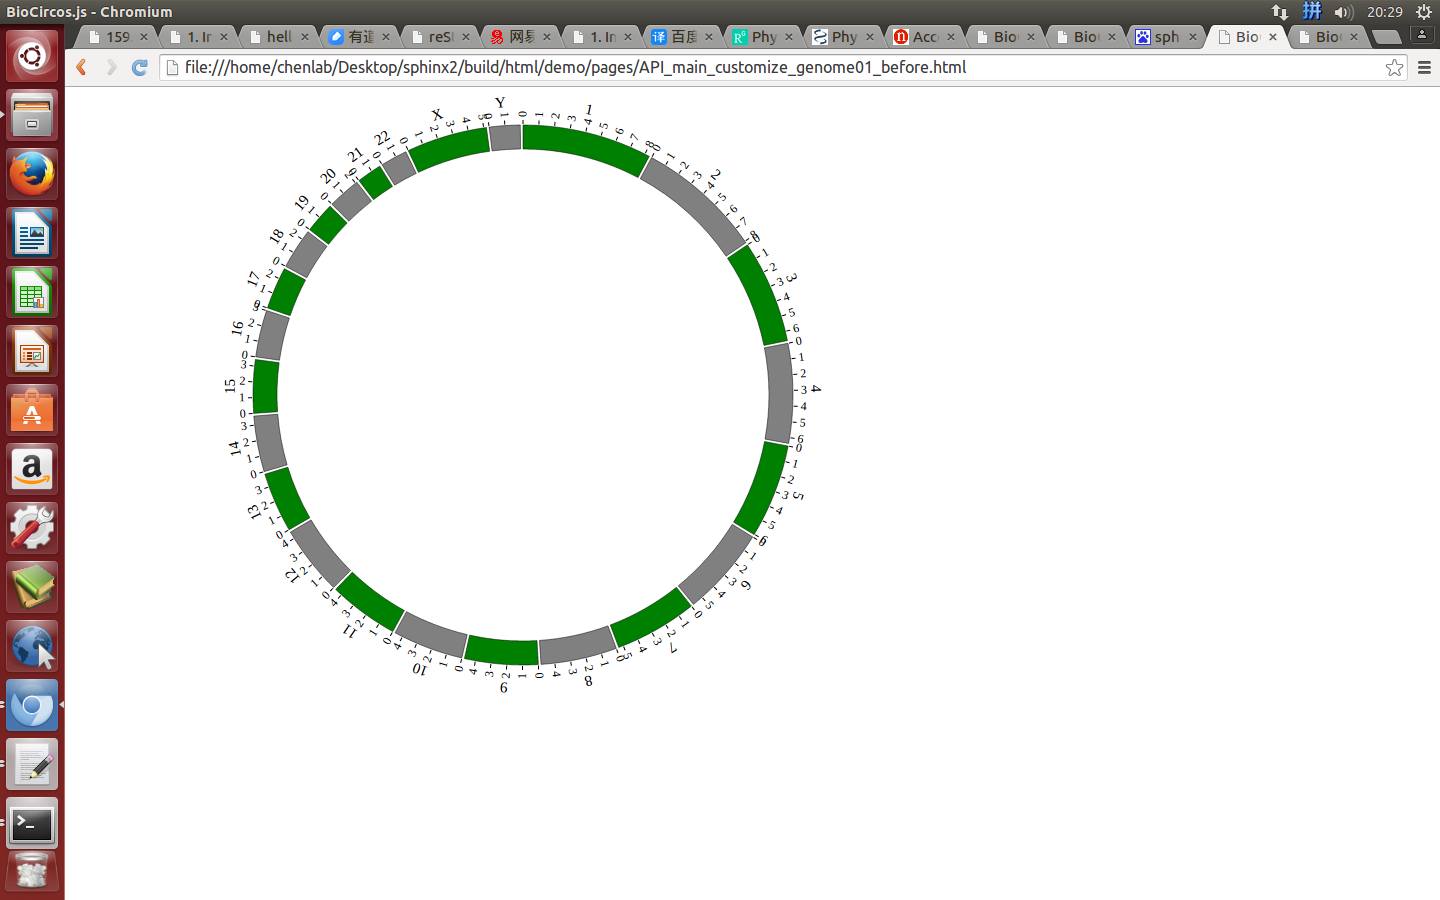
|
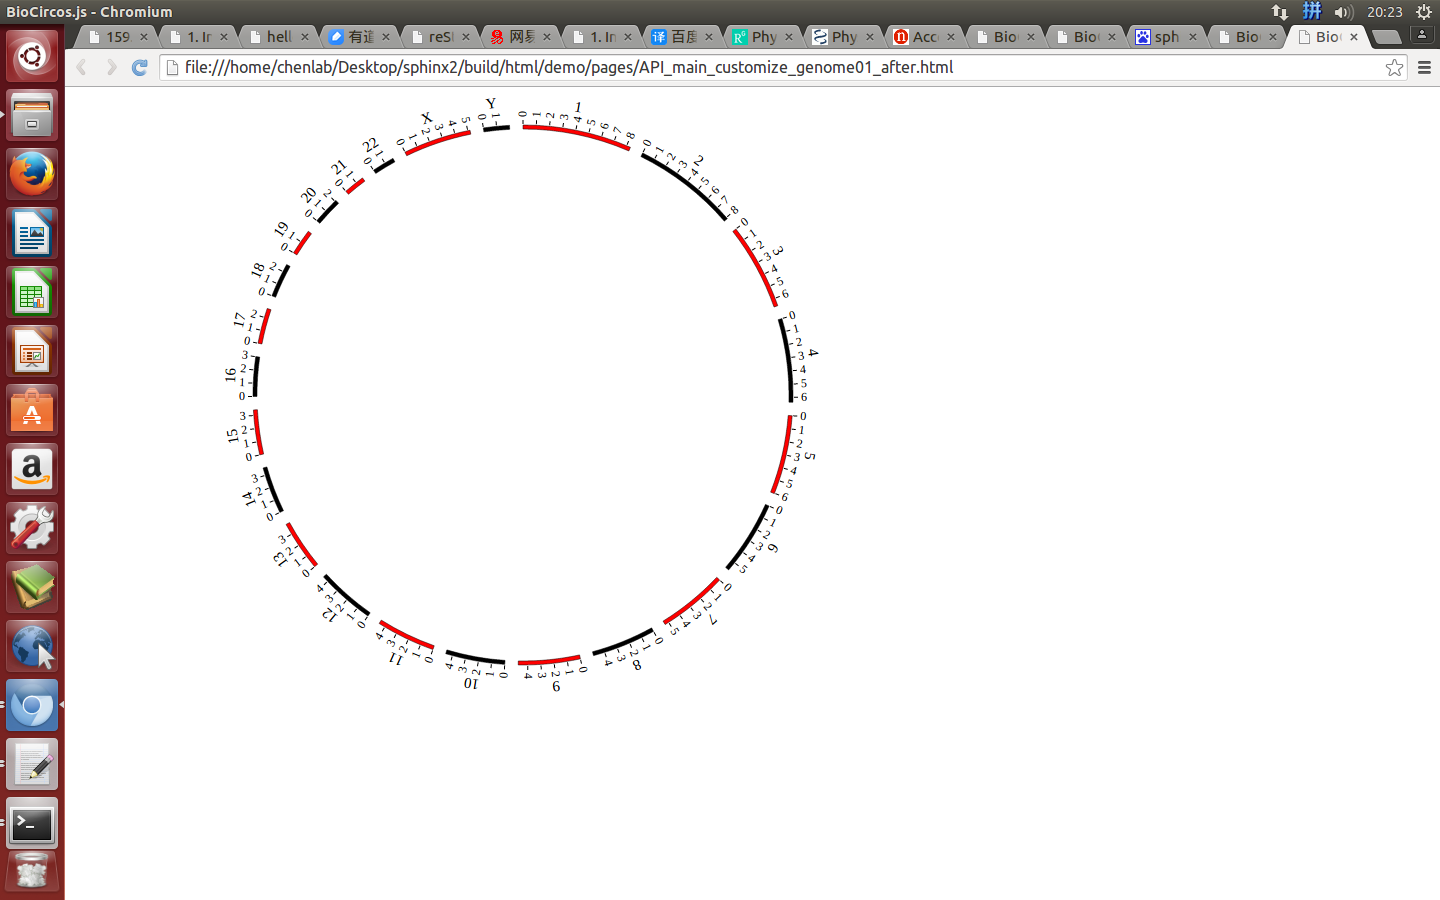
|
genomeBorder
genomeBorder : {
   "display" : true,
   "borderColor" : "#000",
   "borderSize" : 0.5
},
displaydefault true, [true/false], dispaly/not dispaly genome border
borderColordefault “#000”, genome border color
borderSizedefault 0.5, genome border size
Example: change the width and color of genome border
| Example | Before | After |
|---|---|---|
| Code change | genomeBorder : {
"display" : true,
"borderColor" : "#000",
"borderSize" : 0.5
},
|
genomeBorder : {
   "display" : true,
   "borderColor" : "yellow",
   "borderSize" : 2
},
|
| Image change | 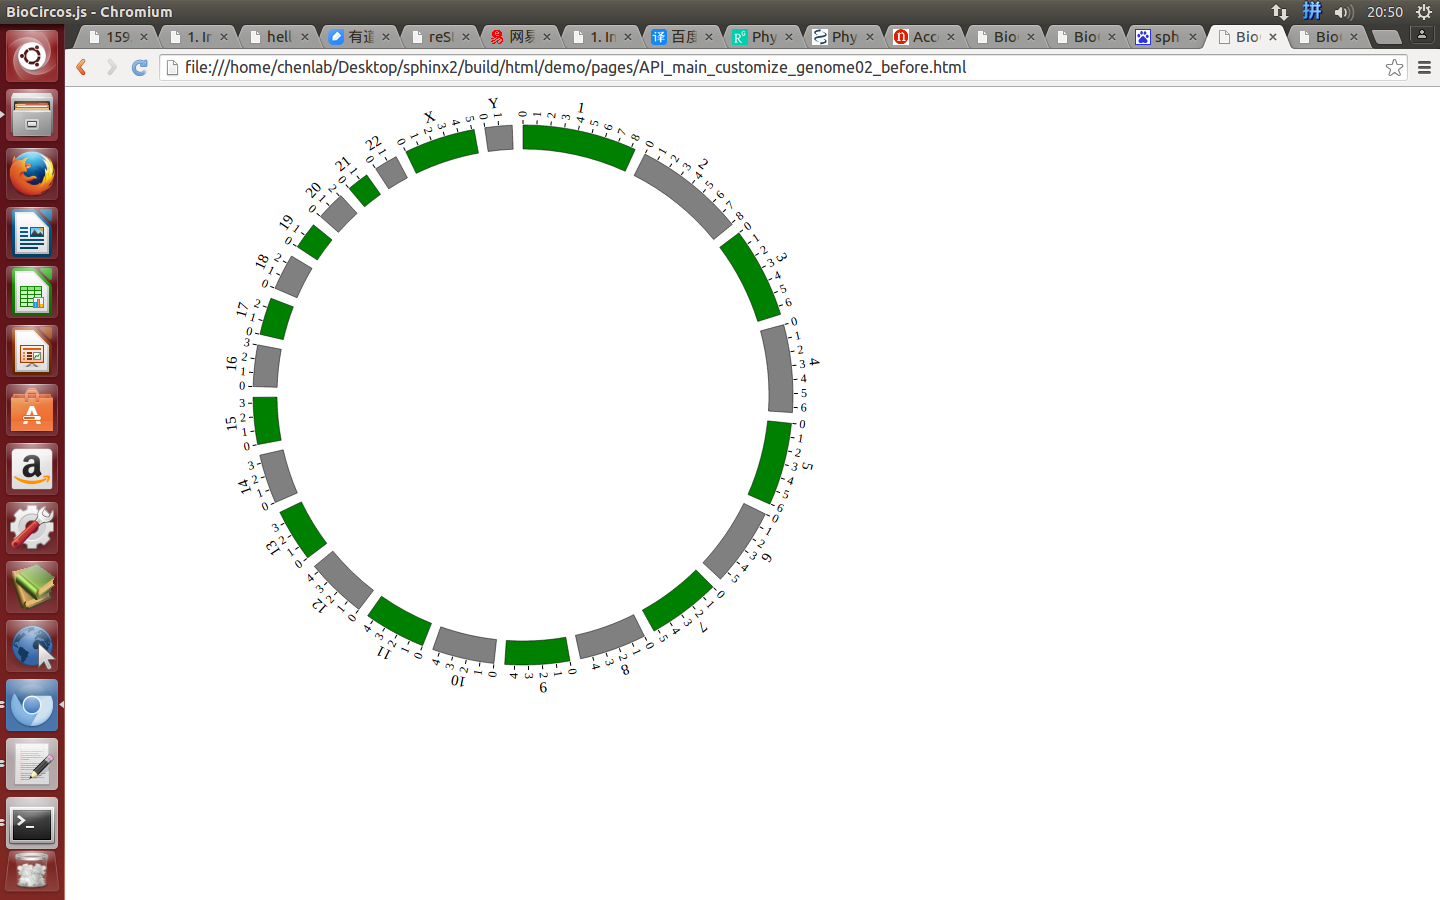
|
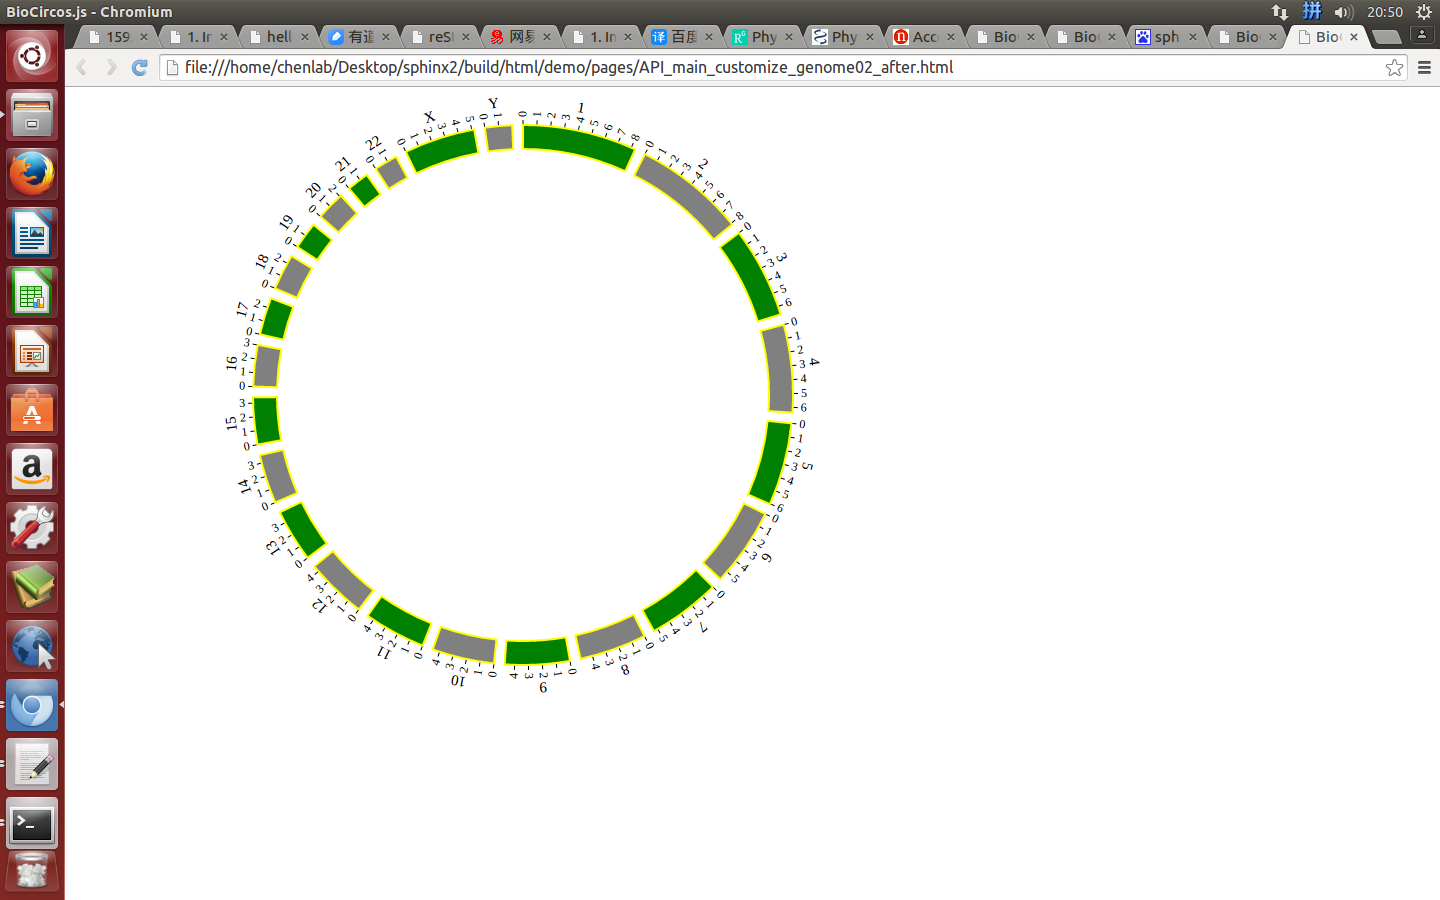
|
ticks
ticks : {
   "display" : true,
   "len" : 5,
   "color" : "#000",
   "textSize" : 10,
   "textColor" : "#000",
   "scale" : 30000000
},
displaydefault true, [true/false], dispaly/not dispaly genome ticks
lendefault 5, length of genome ticks
colordefault “#000”, color of genome ticks
textSizedefault 10, size of genome ticks text
textColordefault “#000”, color of genome ticks text
scaledefault 30000000, unit scale of genome ticks
Example: change the length and color of ticks; change the size and color of tick texts
| Example | Before | After |
|---|---|---|
| Code change | ticks : {
"display" : true,
"len" : 5,
"color" : "#000",
"textSize" : 10,
"textColor" : "#000",
"scale" : 30000000
},
|
ticks : {
   "display" : true,
   "len" : 7,
   "color" : "red",
   "textSize" : 15,
   "textColor" : "red",
   "scale" : 50000000
},
|
| Image change | 
|
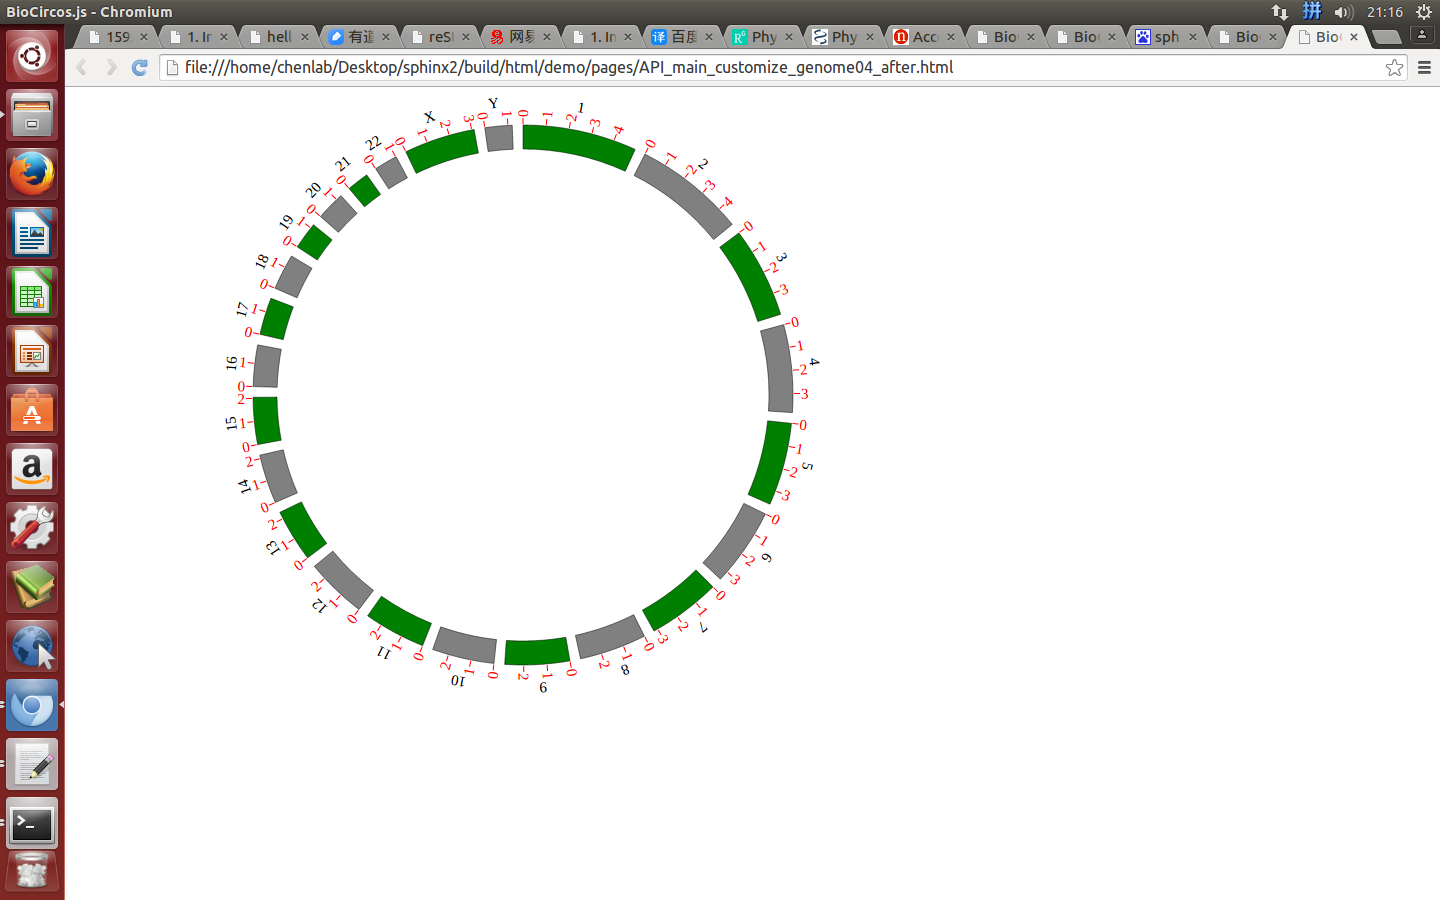
|
genomeLabel
genomeLabel : {
   "display" : true,
   "textSize" : 15,
   "textColor" : "#000",
   "dx" : 0.028,
   "dy" : "-0.55em"
}
displaydefault true, [true/false], dispaly/not dispaly genome label
textSizedefault 15, size of genome label text
textColordefault “#000”, color of genome label text
dxdefault 0.028, rotation value of genome label text
dydefault “-0.55em”, distance between center and genome label text
Example: change the color and size of genome label
| Example | Before | After |
|---|---|---|
| Code change | genomeLabel : {
"display" : true,
"textSize" : 15,
"textColor" : "#000",
"dx" : 0.028,
"dy" : "-0.55em"
},
|
 genomeLabel : {
   "display" : true,
   "textSize" : 17,
   "textColor" : "red",
   "dx" : 0.028,
   "dy" : "-0.55em"
},
|
| Image change | 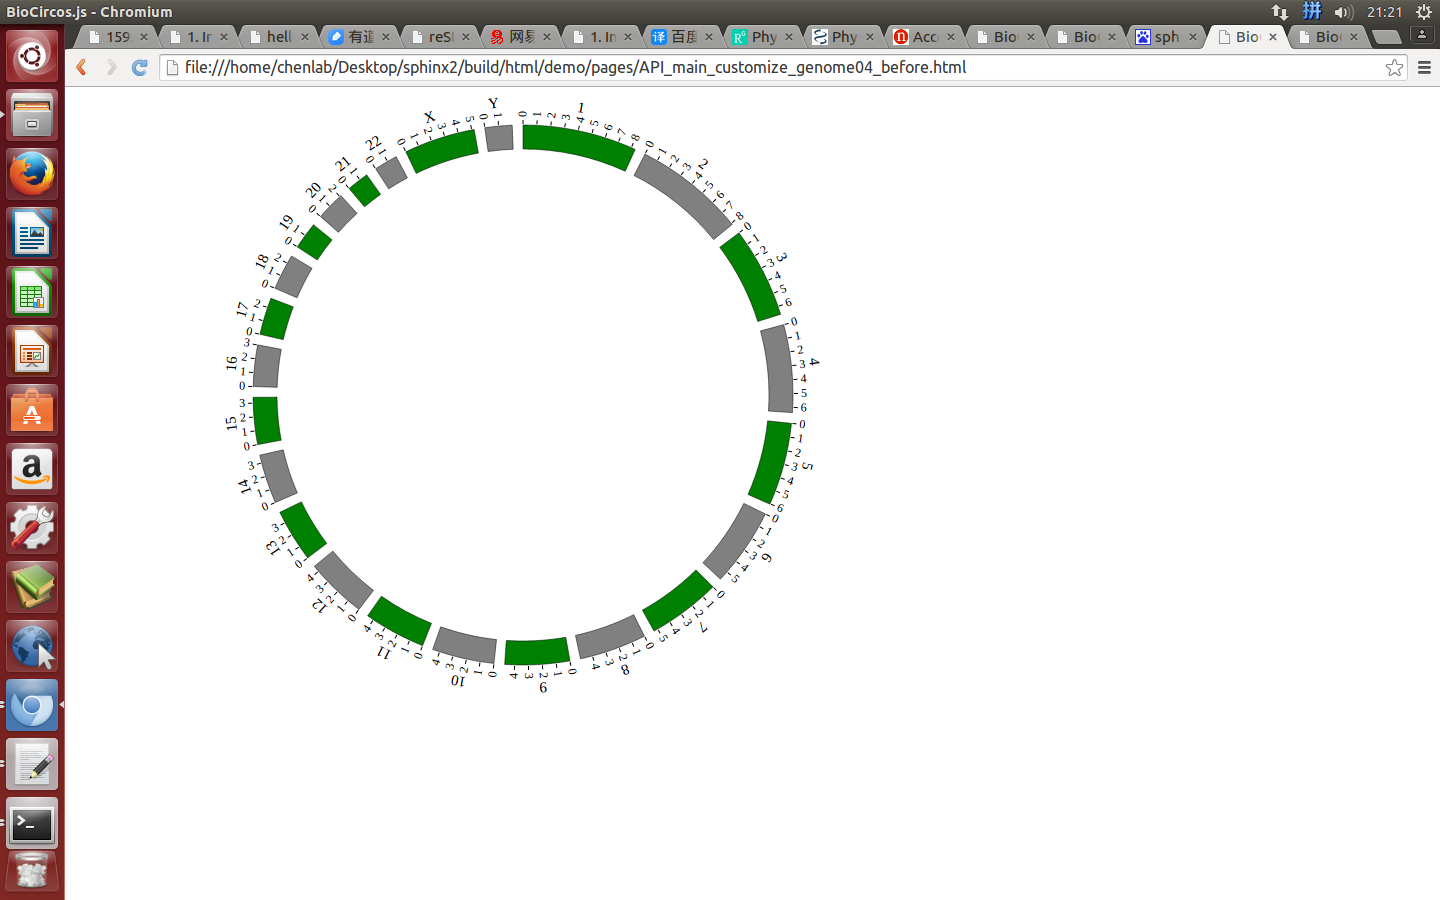
|

|
5.3 Customize Events
Customize Events class is used to customize text drag event, zoom translation event and mouse binding event.
zoom event
Here we show how to customize the zoom event.
BioCircos01 = new BioCircos(BioCircosGenome,{
   zoom : false,
});
zoomdefault false, [true/false], enable/disable SVG zoom and translation
Example: open the zoom event to make SVG enable to zoom and translation
| Example | Before | After |
|---|---|---|
| Code change | zoom : false,
|
zoom : true,
|
| Image change | 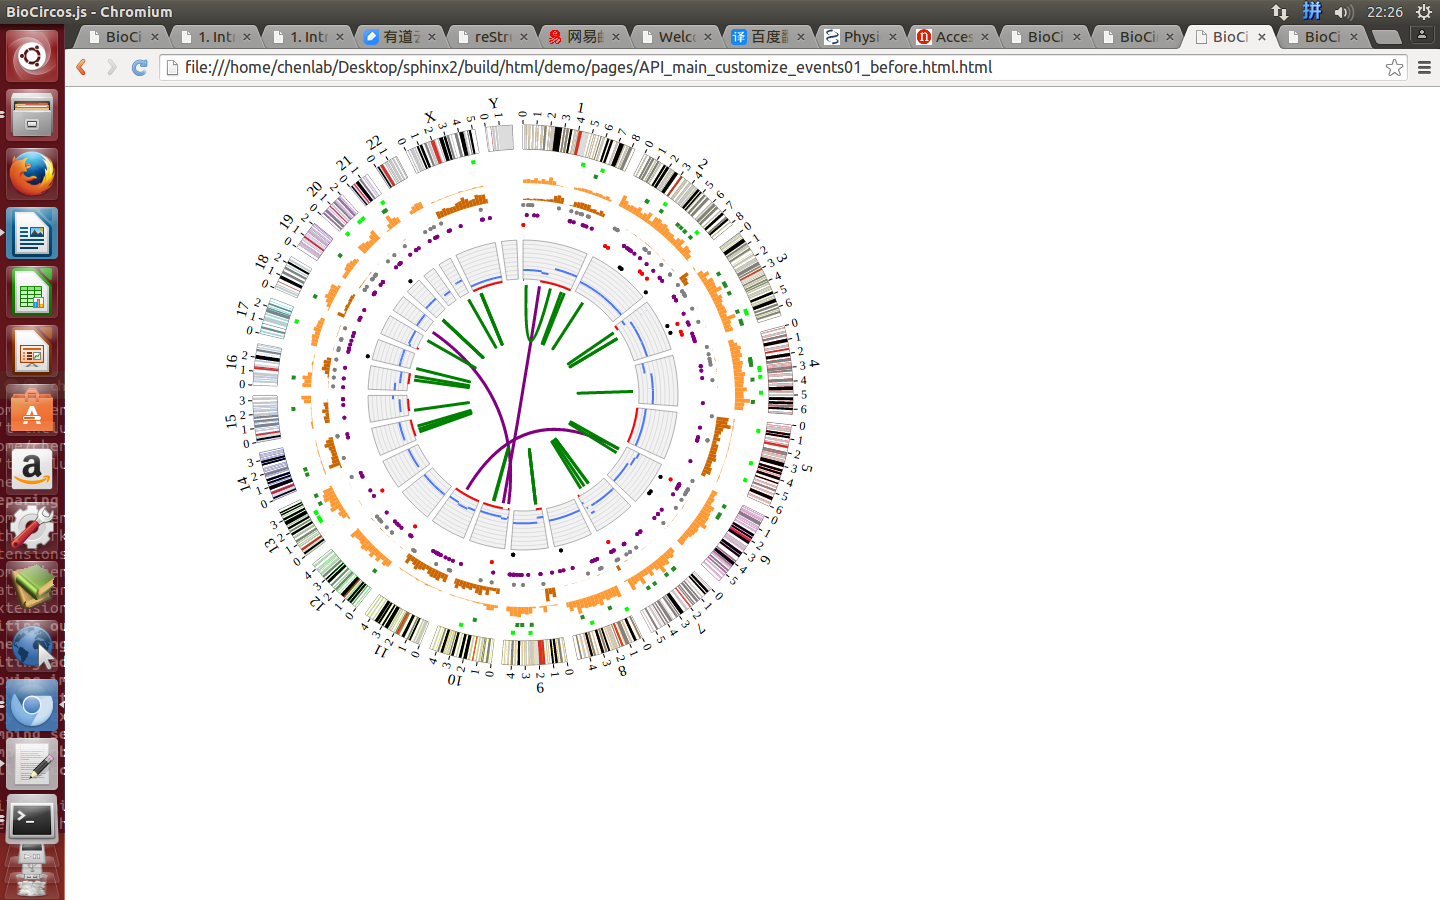
|
|
TEXT module
Here we show how to customize the TEXTModuleDragEvent event.
BioCircos01 = new BioCircos(BioCircosGenome,{
   TEXTModuleDragEvent : true,
});
TEXTModuleDragEventdefault true, [true/false], open/not open TEXT module label drag event
Example: open TEXT module label drag event
| Example | Before | After |
|---|---|---|
| Code change | TEXTModuleDragEvent : false,
|
TEXTModuleDragEvent : true,
|
| Image change | 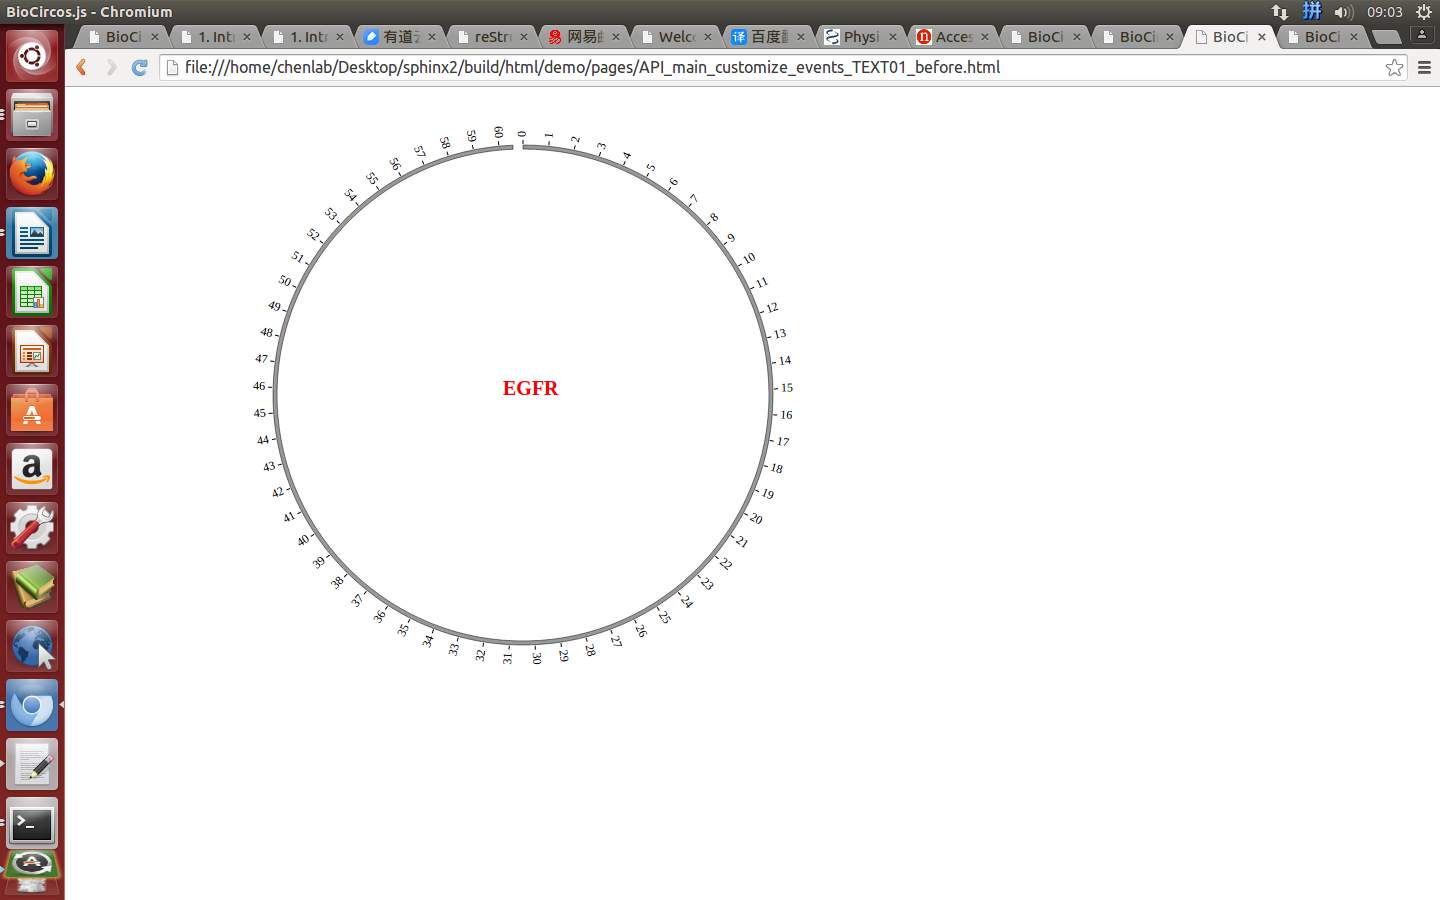
|
|
SNP module
(1)All configuration parameters
Here we show all the configuration parameters in SNP module of Customize Events class.
BioCircos01 = new BioCircos(BioCircosGenome,{
   // Main configuration - Customize events -SNP module
   SNPMouseEvent : true,
   SNPMouseClickDisplay : false,
   SNPMouseClickColor : "red",
   SNPMouseClickCircleSize : 4,
   SNPMouseClickCircleOpacity : 1.0,
   SNPMouseClickCircleStrokeColor : "#F26223",
   SNPMouseClickCircleStrokeWidth : 0,
   SNPMouseClickTextFromData : "fourth",
   SNPMouseClickTextOpacity : 1.0,
   SNPMouseClickTextColor : "red",
   SNPMouseClickTextSize : 8,
   SNPMouseClickTextPostionX : 1.0,
   SNPMouseClickTextPostionY : 10.0,
   SNPMouseClickTextDrag : true,
   SNPMouseDownDisplay : false,
   SNPMouseDownColor : "green",
   SNPMouseDownCircleSize : 4,
   SNPMouseDownCircleOpacity : 1.0,
   SNPMouseDownCircleStrokeColor : "#F26223",
   SNPMouseDownCircleStrokeWidth : 0,
   SNPMouseEnterDisplay : false,
   SNPMouseEnterColor : "yellow",
   SNPMouseEnterCircleSize : 4,
   SNPMouseEnterCircleOpacity : 1.0,
   SNPMouseEnterCircleStrokeColor : "#F26223",
   SNPMouseEnterCircleStrokeWidth : 0,
   SNPMouseLeaveDisplay : false,
   SNPMouseLeaveColor : "pink",
   SNPMouseLeaveCircleSize : 4,
   SNPMouseLeaveCircleOpacity : 1.0,
   SNPMouseLeaveCircleStrokeColor : "#F26223",
   SNPMouseLeaveCircleStrokeWidth : 0,
   SNPMouseMoveDisplay : false,
   SNPMouseMoveColor : "red",
   SNPMouseMoveCircleSize : 2,
   SNPMouseMoveCircleOpacity : 1.0,
   SNPMouseMoveCircleStrokeColor : "#F26223",
   SNPMouseMoveCircleStrokeWidth : 0,
   SNPMouseOutDisplay : false,
   SNPMouseOutAnimationTime : 500,
   SNPMouseOutColor : "red",
   SNPMouseOutCircleSize : 2,
   SNPMouseOutCircleOpacity : 1.0,
   SNPMouseOutCircleStrokeColor : "red",
   SNPMouseOutCircleStrokeWidth : 0,
   SNPMouseUpDisplay : false,
   SNPMouseUpColor : "grey",
   SNPMouseUpCircleSize : 4,
   SNPMouseUpCircleOpacity : 1.0,
   SNPMouseUpCircleStrokeColor : "#F26223",
   SNPMouseUpCircleStrokeWidth : 0,
   SNPMouseOverDisplay : false,
   SNPMouseOverColor : "red",
   SNPMouseOverCircleSize : 2,
   SNPMouseOverCircleOpacity : 1.0,
   SNPMouseOverCircleStrokeColor : "#F26223",
   SNPMouseOverCircleStrokeWidth : 3,
});
(2)Configuration and examples
SNPMouseEventdefault true, [true/false], open/not open mouse event of SNP module
Mouse click
SNPMouseClickDisplaydefault true, [true/false], open/not open mouse click event of SNP module
SNPMouseClickColordefault “red”, “none” means no change, element change color after click the element
SNPMouseClickCircleSizedefault 4, “none” means no change, element change circle size after click the element.
SNPMouseClickCircleOpacitydefault 1.0, “none” means no change, element change opacity after click the element
SNPMouseClickCircleStrokeColordefault “#F26223”, “none” means no change, element change stroke color after click the element.
SNPMouseClickCircleStrokeWidthdefault 0, “none” means no change, element change stroke width after click the element.
SNPMouseClickTextFromDatadefault “fourth”, first,second,third,fourth column data click to show
SNPMouseClickTextOpacitydefault 1.0, text opacity after click the element
SNPMouseClickTextColordefault “red”, text color after click the element
SNPMouseClickTextSizedefault 8, text size after click the element
SNPMouseClickTextPostionXdefault 1.0, text x position after click the element
SNPMouseClickTextPostionYdefault 10.0, text y position after click the element
SNPMouseClickTextDragdefault true, [true/false], open/not open text drag function
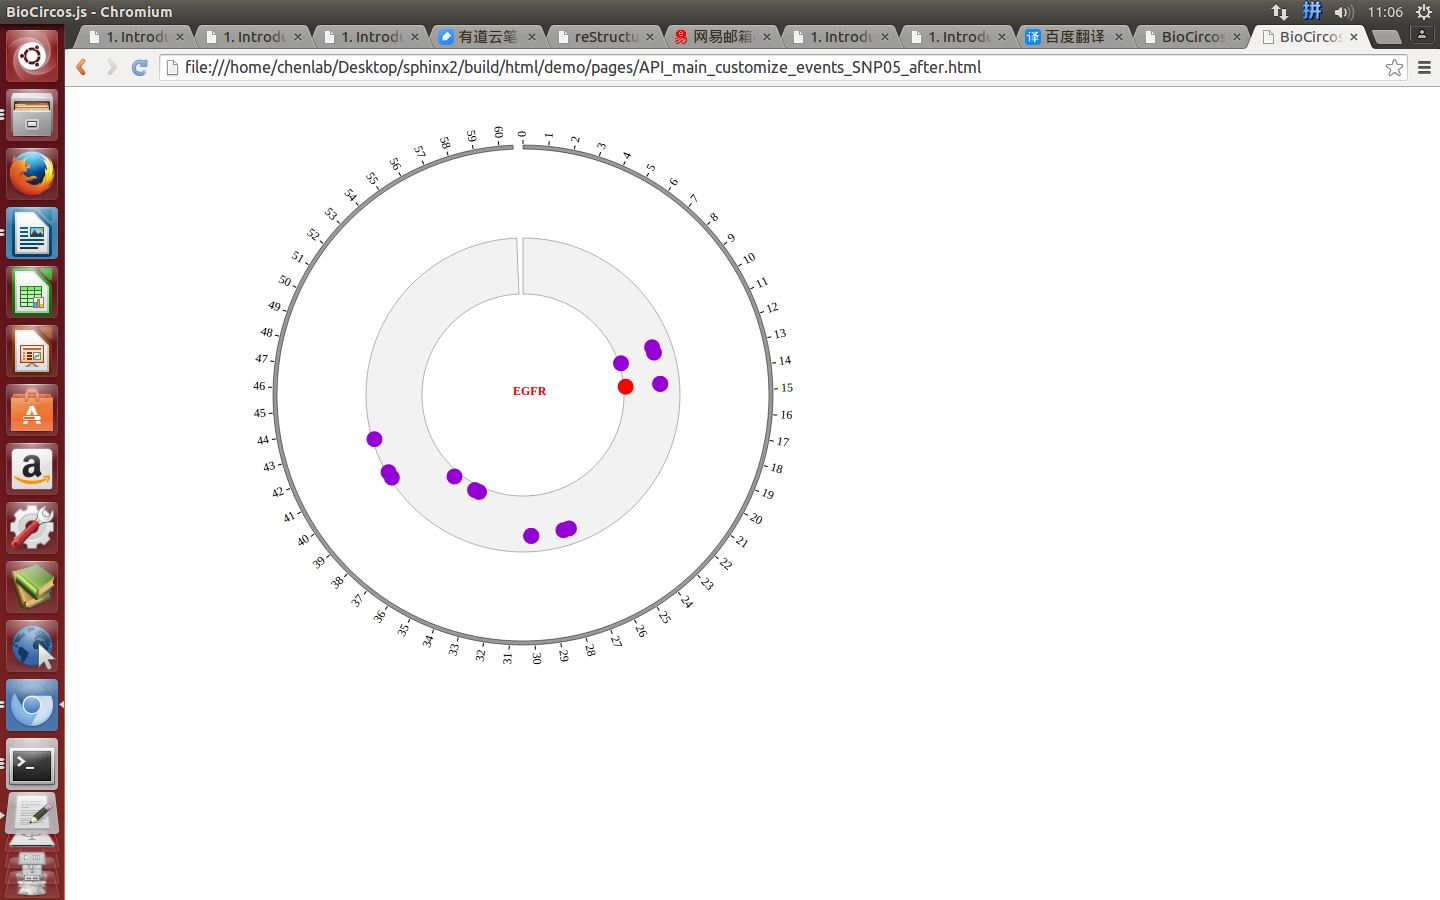
Example: change the circle size and color when mouse click; change the annotated text content when mouse click;
| Example | Before | After |
|---|---|---|
| Code change | SNPMouseClickColor : "red",
SNPMouseClickCircleSize : 4,
SNPMouseClickTextFromData : "second",
|
SNPMouseClickColor : "blue",
SNPMouseClickCircleSize : 8,
SNPMouseClickTextFromData : "fourth",
|
| Image change | 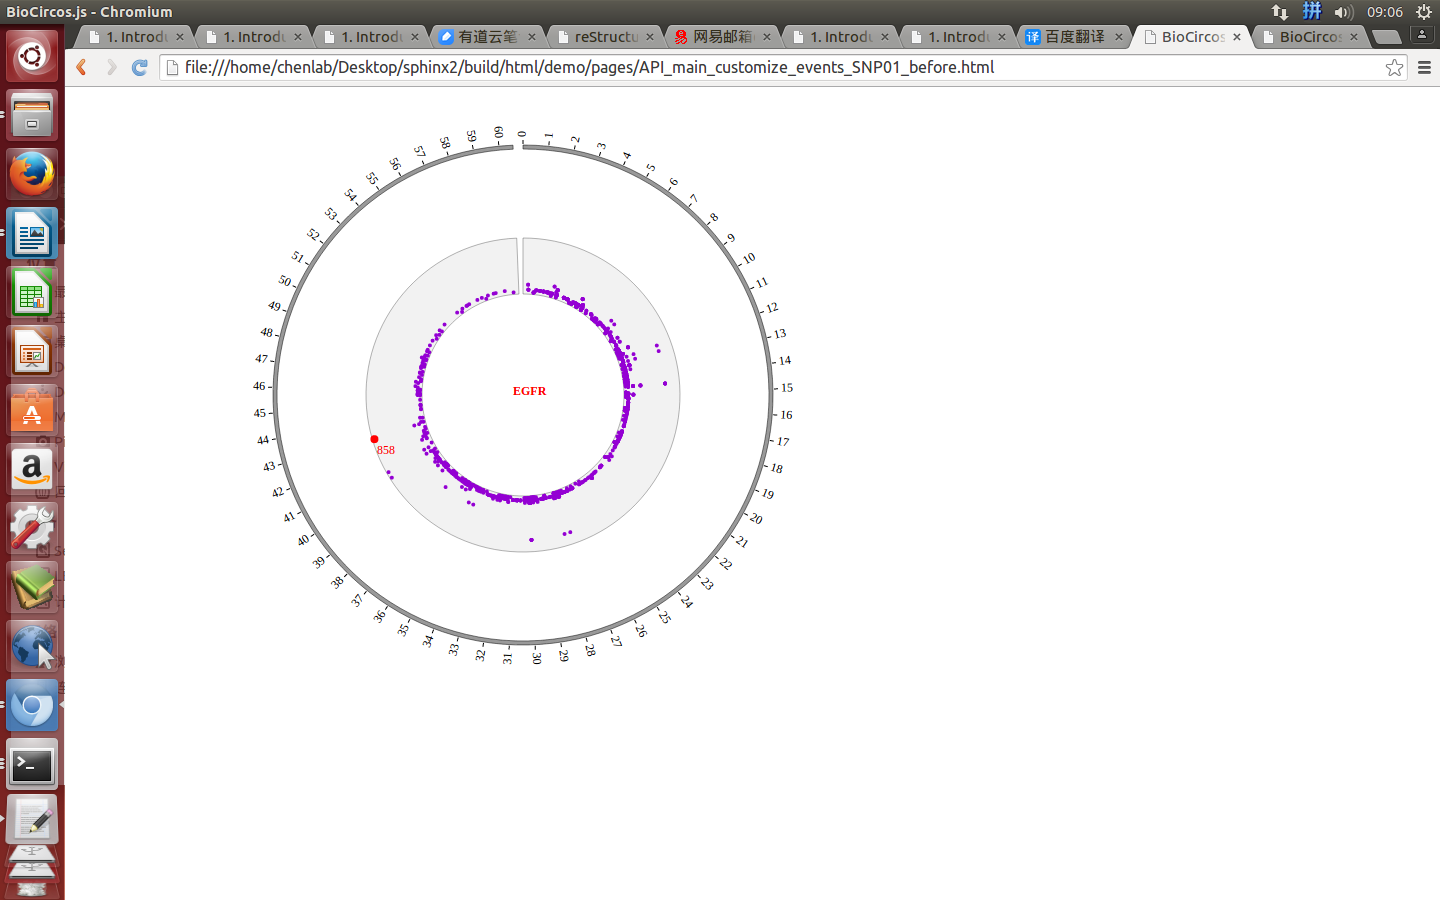
|
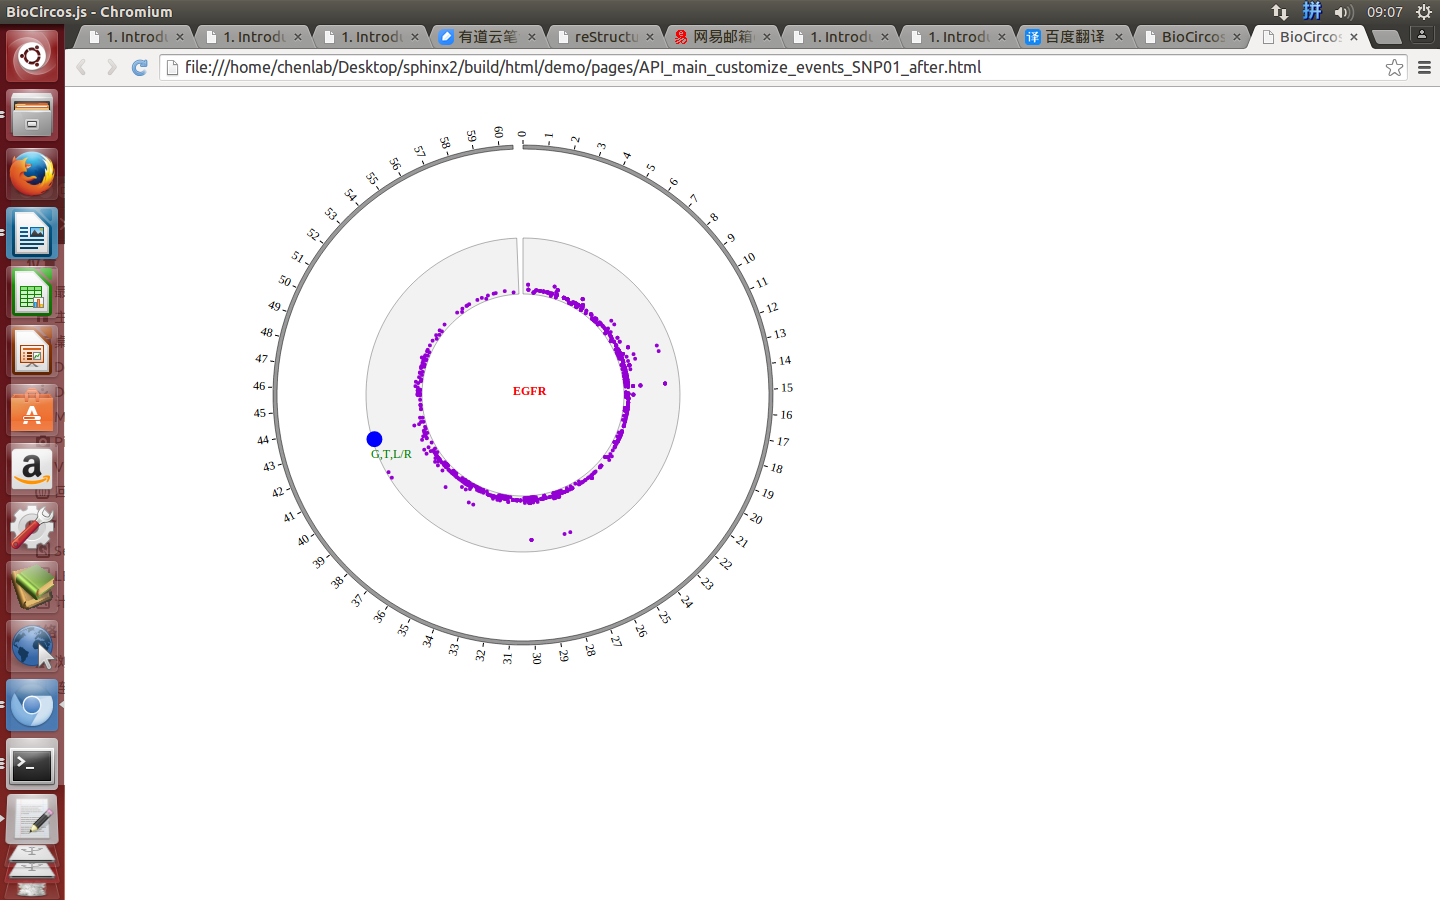
|
Mouse down
SNPMouseDownDisplaydefault false, [true/false], open/not open mouse mouse down event of SNP module
SNPMouseDownColordefault “green”, “none” means no change, element change color after mouse down the element
SNPMouseDownCircleSizedefault 4, “none” means no change, element change circle size after mouse down the element.
SNPMouseDownCircleOpacitydefault 1.0, “none” means no change, element change opacity after mouse down the element
SNPMouseDownCircleStrokeColordefault “#F26223”, “none” means no change, element change stroke color after mouse down the element.
SNPMouseDownCircleStrokeWidthdefault 0, “none” means no change, element change stroke width after mouse down the element.
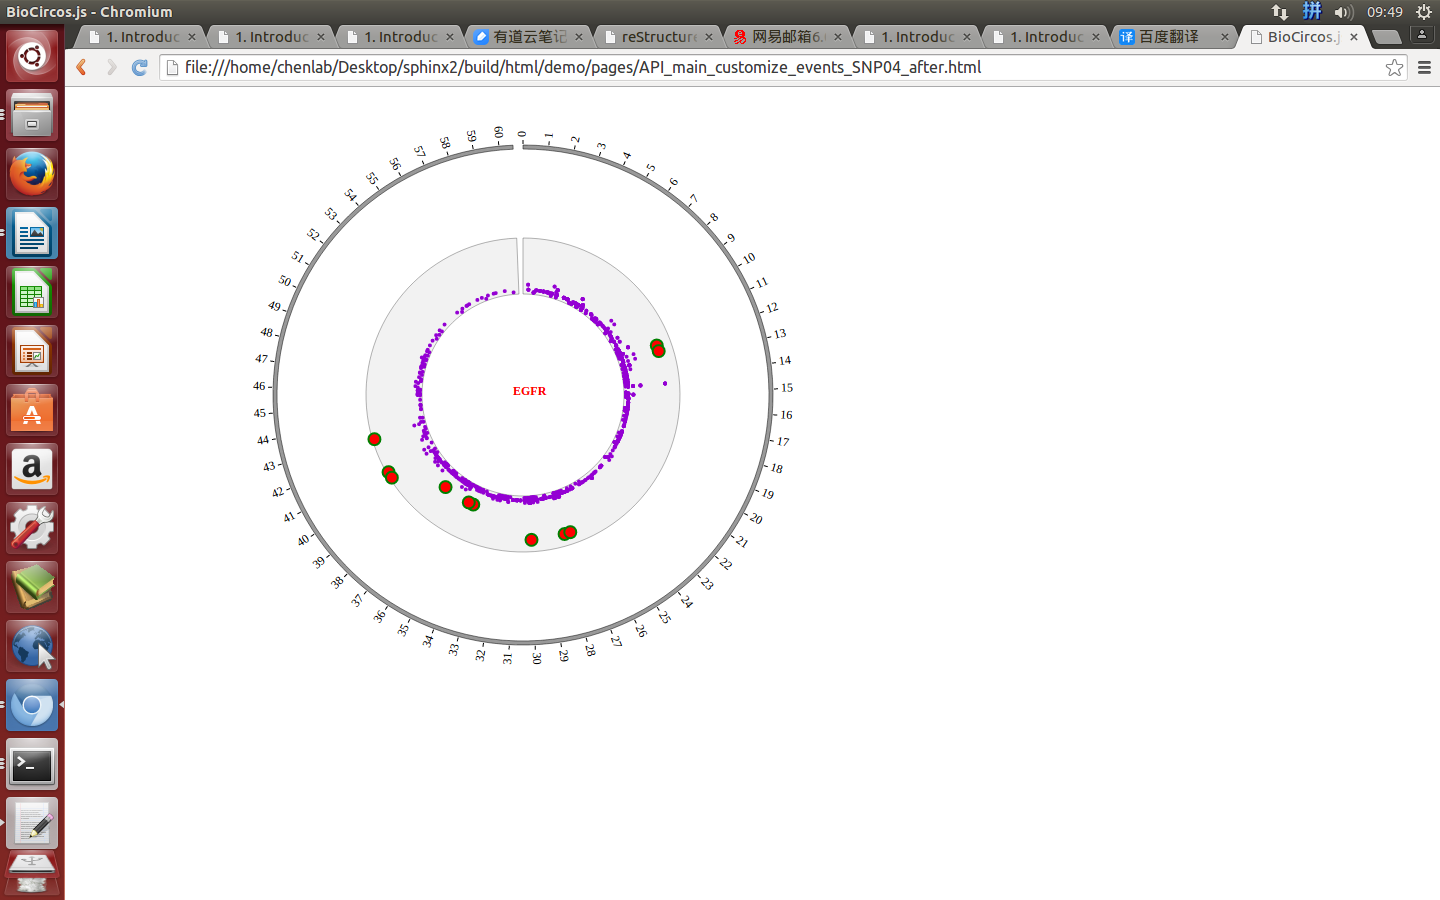
Example: change the color, size, opacity and stroke color of the circle when mouse down.
| Example | Before | After |
|---|---|---|
| Code change | SNPMouseDownColor : "green",
SNPMouseDownCircleSize : 4,
SNPMouseDownCircleOpacity : 1.0,
SNPMouseDownCircleStrokeColor : "#F26223",
|
SNPMouseDownColor : "blue",
SNPMouseDownCircleSize : 8,
SNPMouseDownCircleOpacity : 0.5,
SNPMouseDownCircleStrokeColor : "red",
|
| Image change | 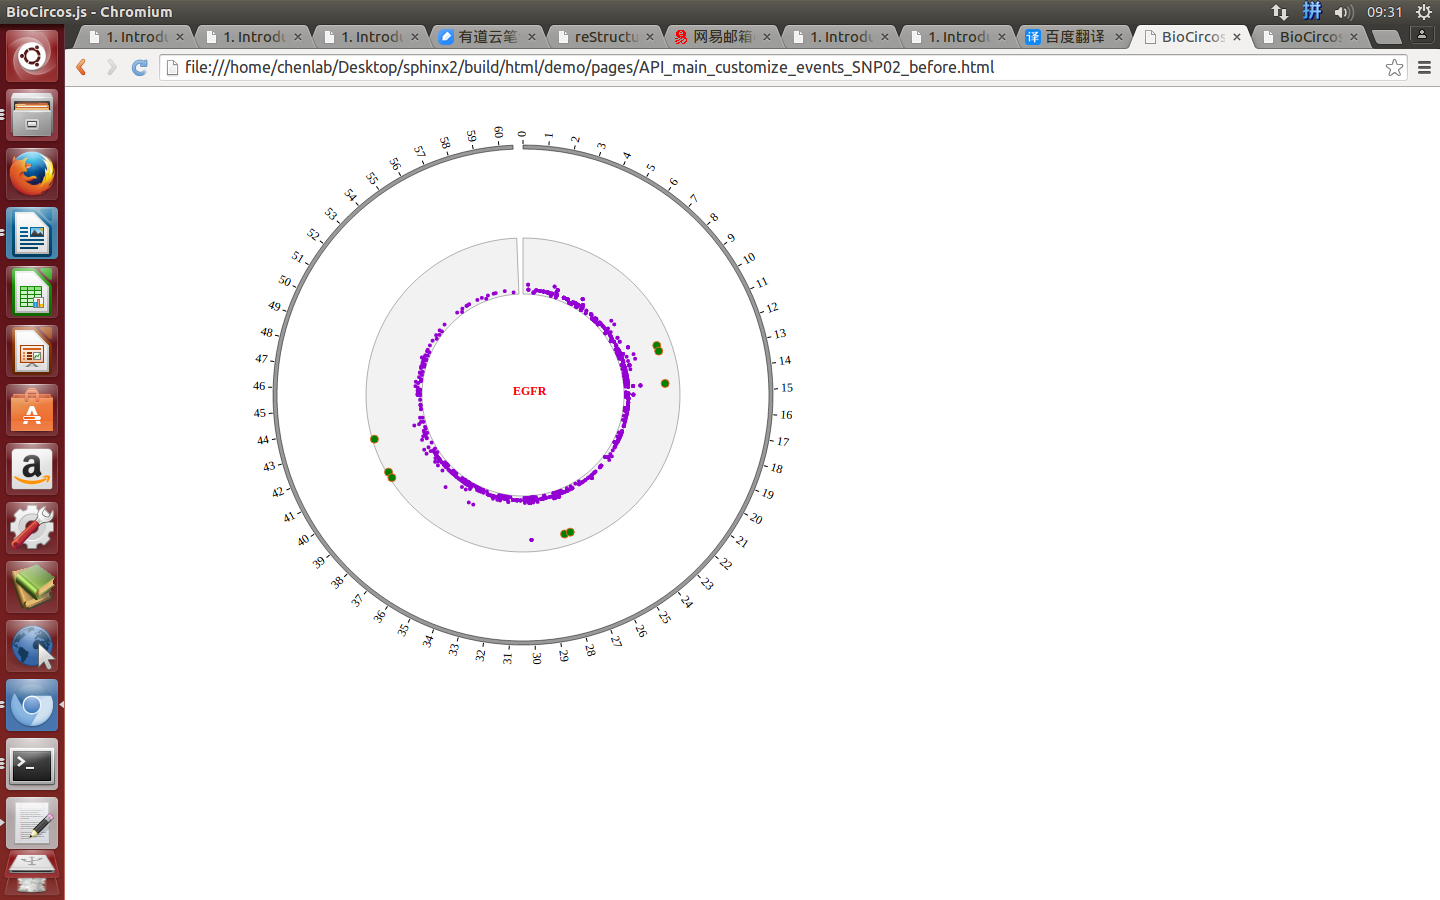
|

|
Mouse enter
SNPMouseEnterDisplaydefault false, [true/false], open/not open mouse mouse enter event of SNP module
SNPMouseEnterColordefault “yellow”, “none” means no change, element change color after mouse enter the element
SNPMouseEnterCircleSizedefault 4, “none” means no change, element change circle size after mouse enter the element.
SNPMouseEnterCircleOpacitydefault 1.0, “none” means no change, element change opacity after mouse enter the element
SNPMouseEnterCircleStrokeColordefault “#F26223”, “none” means no change, element change stroke color after mouse enter the element.
SNPMouseEnterCircleStrokeWidthdefault 0, “none” means no change, element change stroke width after mouse enter the element.
Example: change color, stroke color and opacity of the circle when mouse enter the element;
| Example | Before | After |
|---|---|---|
| Code change | SNPMouseEnterColor : "yellow",
SNPMouseEnterCircleOpacity : 1.0,
SNPMouseEnterCircleStrokeColor : "#F26223",
|
SNPMouseEnterColor : "red",
SNPMouseEnterCircleOpacity : 0.7,
SNPMouseEnterCircleStrokeColor : "green",
|
| Image change | 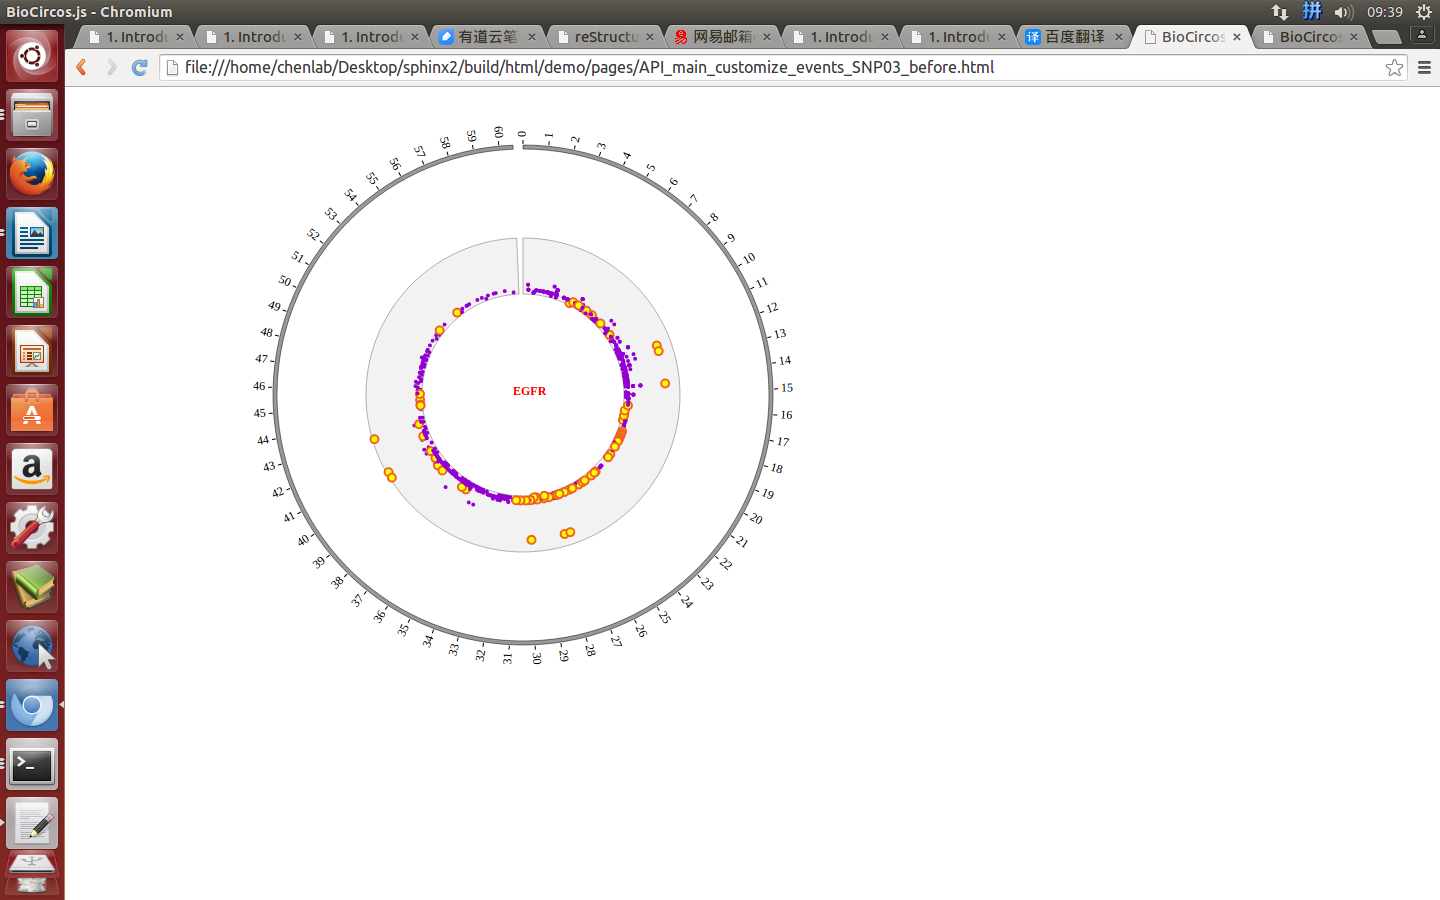
|

|
Mouse leave
SNPMouseLeaveDisplaydefault false, [true/false], open/not open mouse mouse leave event of SNP module
SNPMouseLeaveColordefault “pink”, “none” means no change, element change color after mouse leave the element
SNPMouseLeaveCircleSizedefault 4, “none” means no change, element change circle size after mouse leave the element.
SNPMouseLeaveCircleOpacitydefault 1.0, “none” means no change, element change opacity after mouse leave the element
SNPMouseLeaveCircleStrokeColordefault “#F26223”, “none” means no change, element change stroke color after mouse leave the element.
SNPMouseLeaveCircleStrokeWidthdefault 0, “none” means no change, element change stroke width after mouse leave the element.
Example: change color, size, stroke color and stroke width of the circle when mouse leave the element;
| Example | Before | After |
|---|---|---|
| Code change | SNPMouseLeaveColor : "blue",
SNPMouseLeaveCircleSize : 4,
SNPMouseLeaveCircleStrokeColor : "#F26223",
SNPMouseLeaveCircleStrokeWidth : 1,
|
SNPMouseLeaveColor : "red",
SNPMouseLeaveCircleSize : 6,
SNPMouseLeaveCircleStrokeColor : "green",
SNPMouseLeaveCircleStrokeWidth : 2,
|
| Image change | 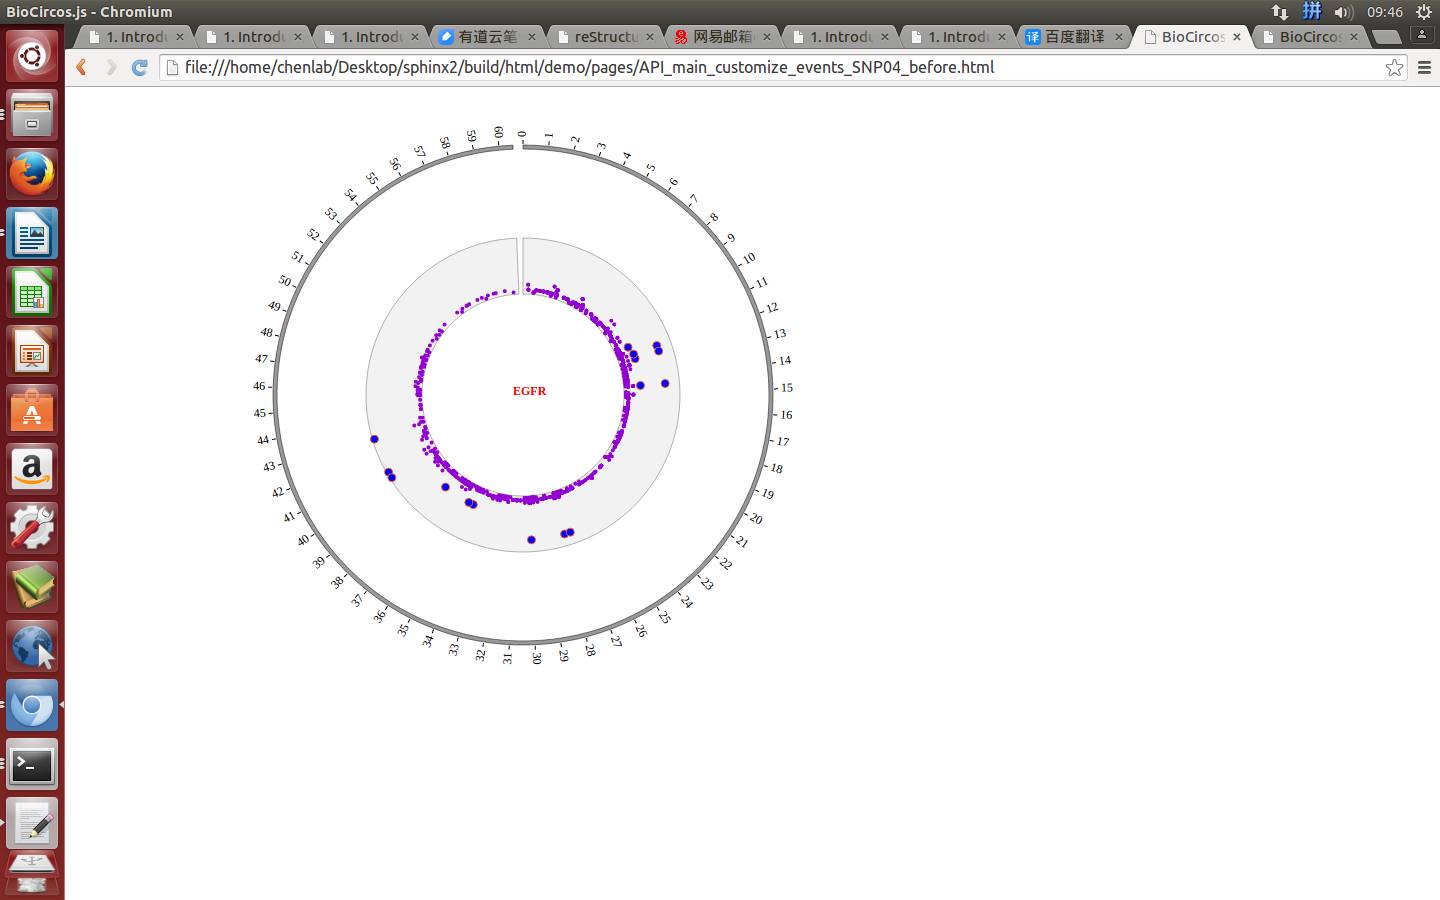
|
|
Mouse move
SNPMouseMoveDisplaydefault false, [true/false], open/not open mouse mouse move event of SNP module
SNPMouseMoveColordefault “red”, “none” means no change, element change color after mouse move the element
SNPMouseMoveCircleSizedefault 2, “none” means no change, element change circle size after mouse move the element.
SNPMouseMoveCircleOpacitydefault 1.0, “none” means no change, element change opacity after mouse move the element
SNPMouseMoveCircleStrokeColordefault “#F26223”, “none” means no change, element change stroke color after mouse move the element.
SNPMouseMoveCircleStrokeWidthdefault 0, “none” means no change, element change stroke width after mouse move the element.
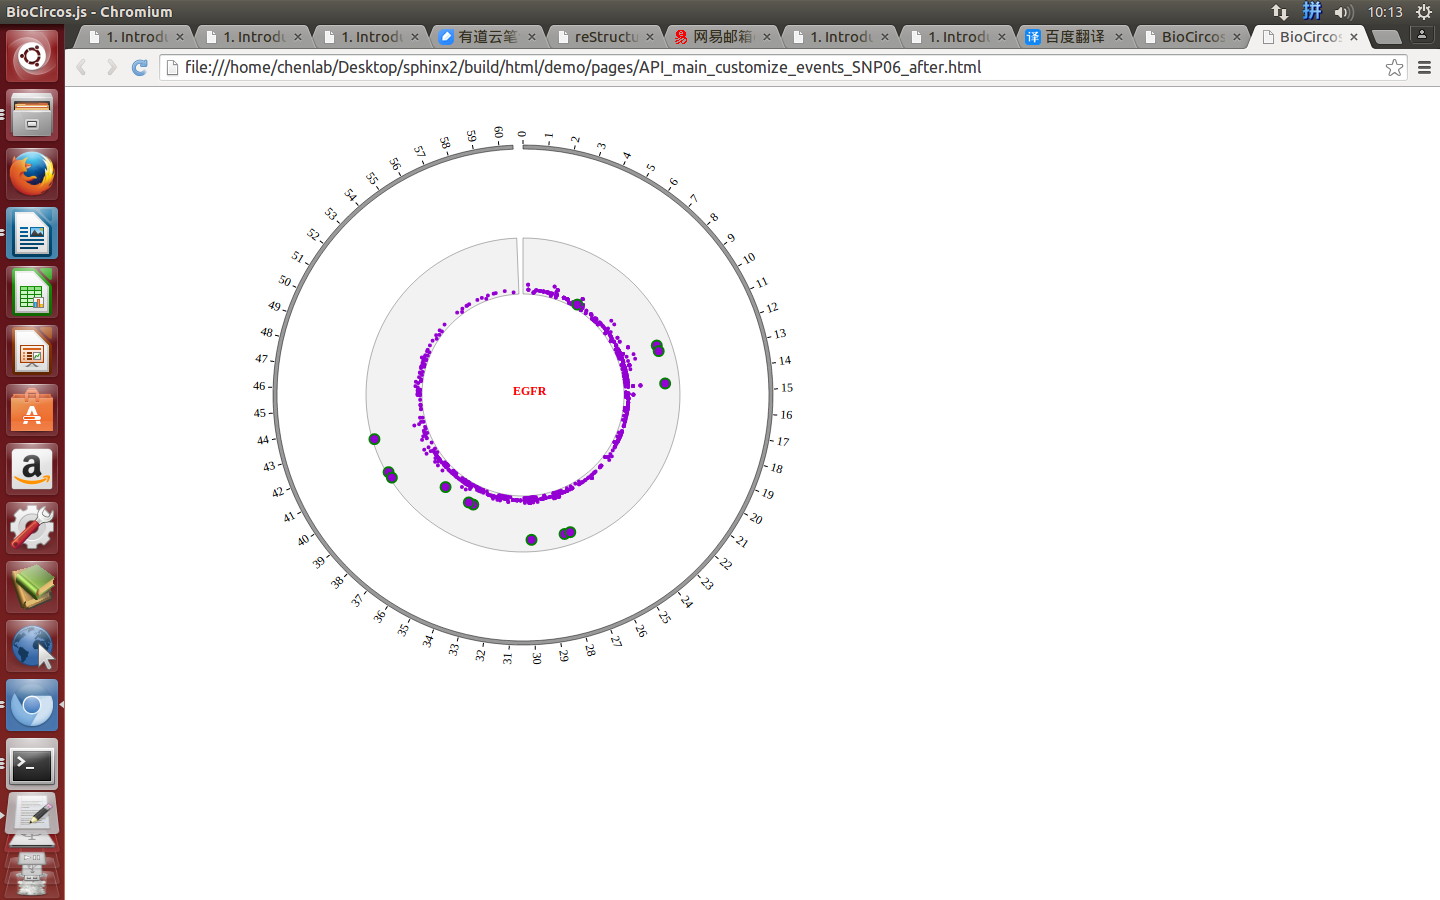
Example: mouse move event and mouse out event
| Example | Before | After |
|---|---|---|
| Code change | SNPMouseMoveColor : "green",
SNPMouseMoveCircleStrokeColor : "blue",
SNPMouseMoveCircleStrokeWidth : 3,
|
SNPMouseMoveColor : "red",
SNPMouseMoveCircleStrokeColor : "#F26223",
SNPMouseMoveCircleStrokeWidth : 0,
SNPMouseOutDisplay : true,
SNPMouseOutAnimationTime : 500,
SNPMouseOutColor : "none",
SNPMouseOutCircleSize : "none",
SNPMouseOutCircleOpacity : 1.0,
SNPMouseOutCircleStrokeColor : "red",
SNPMouseOutCircleStrokeWidth : 0,
|
| Image change | 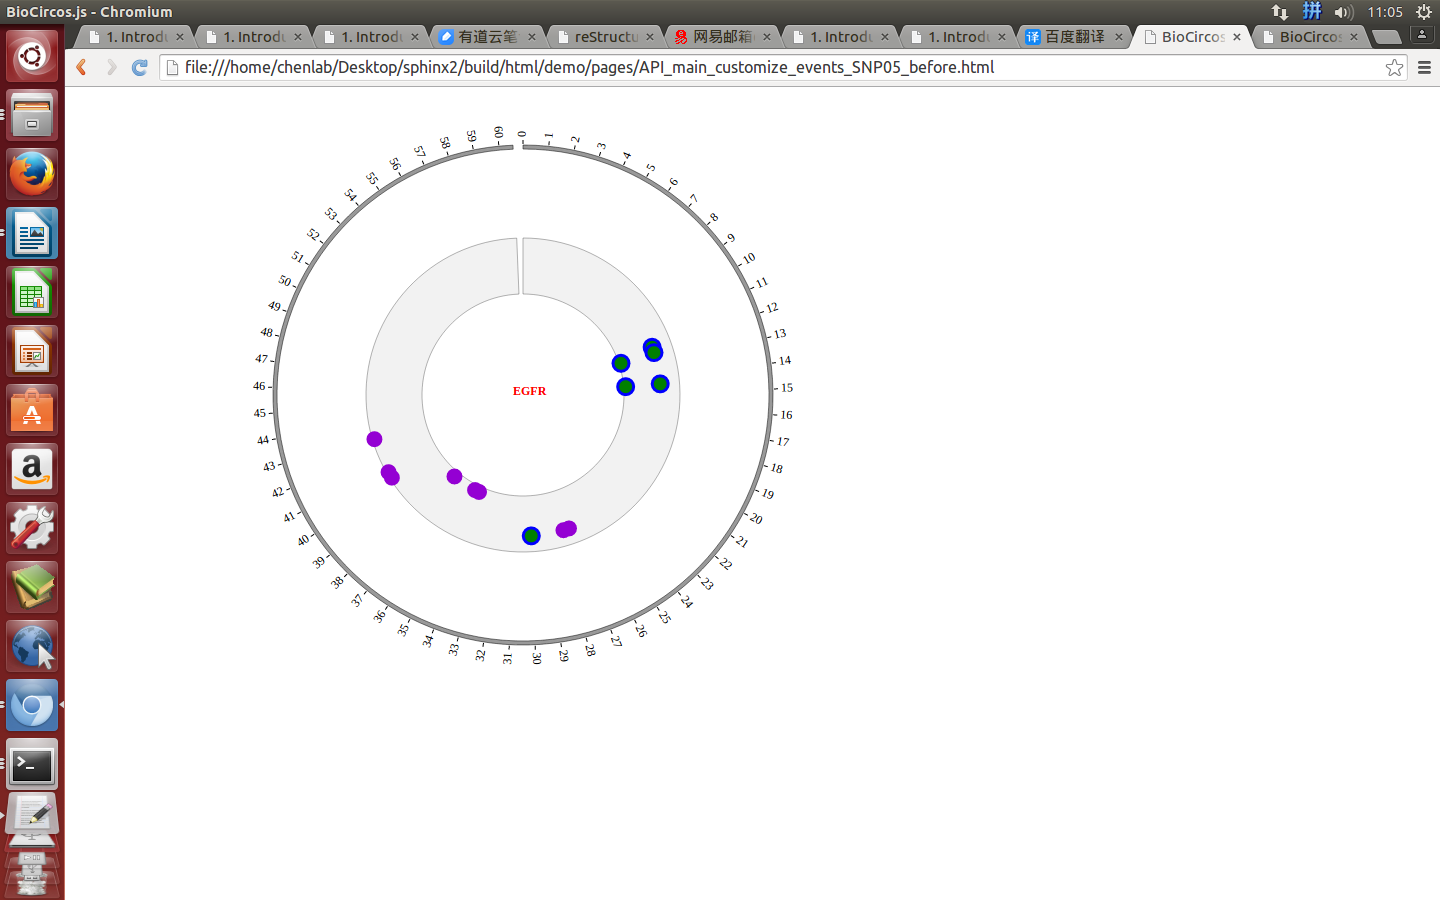
|
|
Mouse out
SNPMouseOutDisplaydefault false, [true/false], open/not open mouse mouse out event of SNP module
SNPMouseOutAnimationTimedefault 500, animation time after mouse out the element
SNPMouseOutColordefault “red”, “none” means no change, element change color after mouse out the element
SNPMouseOutCircleSizedefault 2, “none” means no change, element change circle size after mouse out the element.
SNPMouseOutCircleOpacitydefault 1.0, “none” means no change, element change opacity after mouse out the element
SNPMouseOutCircleStrokeColordefault “red”, “none” means no change, element change stroke color after mouse out the element.
SNPMouseOutCircleStrokeWidthdefault 0, “none” means no change, element change stroke width after mouse out the element.
Example: change animation time, size, stroke color and stroke width of the circle when mouse out the element;
| Example | Before | After |
|---|---|---|
| Code change | SNPMouseOutAnimationTime : 400,
SNPMouseOutCircleSize : 5,
SNPMouseOutCircleStrokeColor : "red",
SNPMouseOutCircleStrokeWidth : 1,
|
SNPMouseOutAnimationTime : 1000,
SNPMouseOutCircleSize : 5,
SNPMouseOutCircleStrokeColor : "green",
SNPMouseOutCircleStrokeWidth : 2,
|
| Image change | 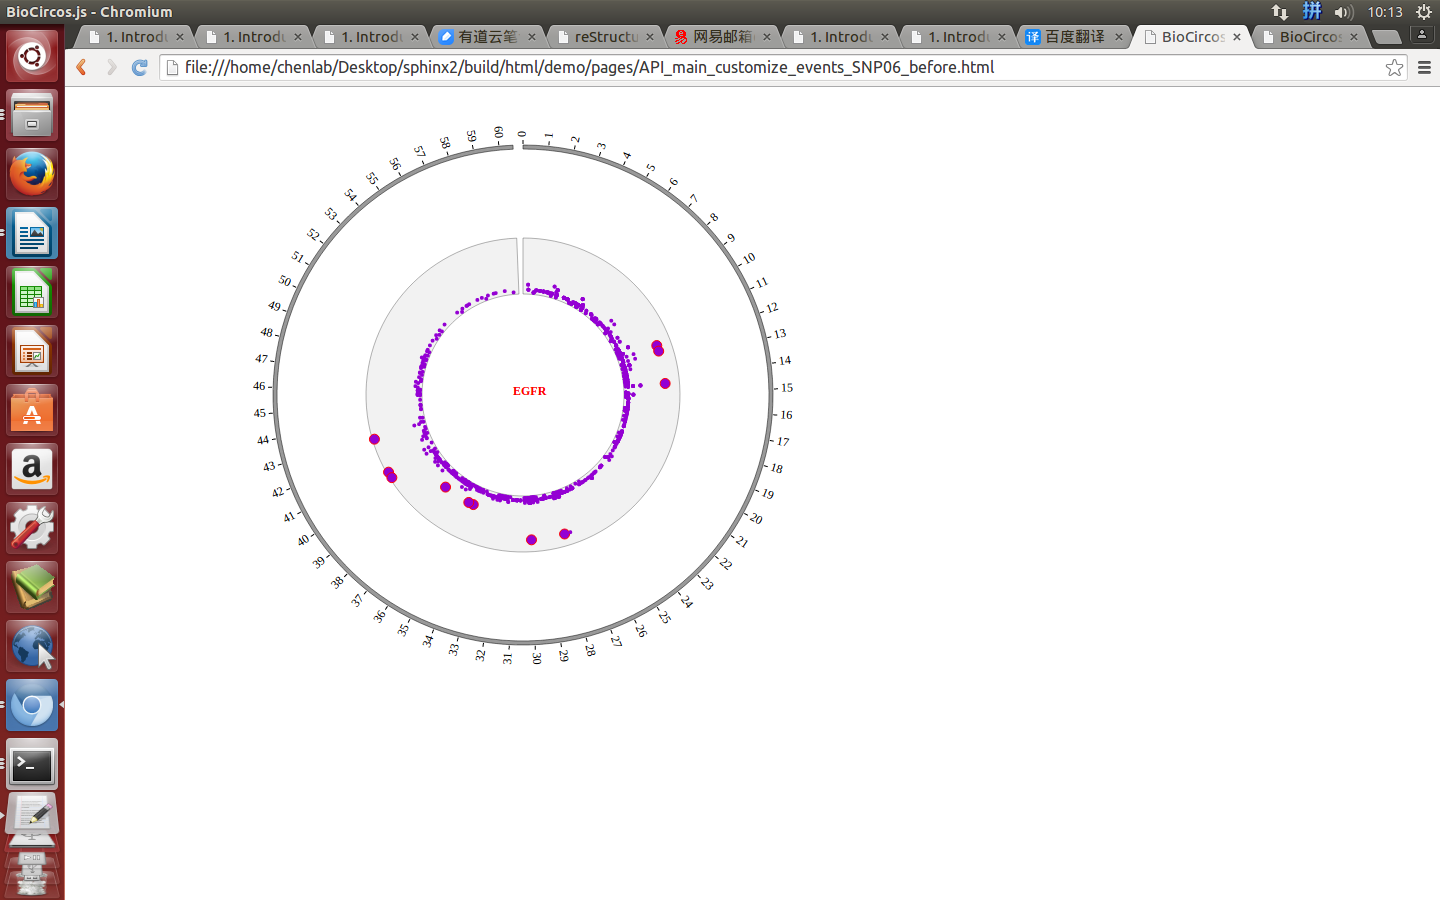
|
|
Mouse up
SNPMouseUpDisplaydefault false, [true/false], open/not open mouse mouse up event of SNP module
SNPMouseUpColordefault “grey”, “none” means no change, element change color after mouse up the element
SNPMouseUpCircleSizedefault 4, “none” means no change, element change circle size after mouse up the element.
SNPMouseUpCircleOpacitydefault 1.0, “none” means no change, element change opacity after mouse up the element
SNPMouseUpCircleStrokeColordefault “#F26223”, “none” means no change, element change stroke color after mouse up the element.
SNPMouseUpCircleStrokeWidthdefault 0, “none” means no change, element change stroke width after mouse up the element.
Example: change size and color of the circle when mouse up the element;
| Example | Before | After |
|---|---|---|
| Code change | SNPMouseUpColor : "grey",
SNPMouseUpCircleSize : 4,
|
SNPMouseUpColor : "red",
SNPMouseUpCircleSize : 6,
|
| Image change | 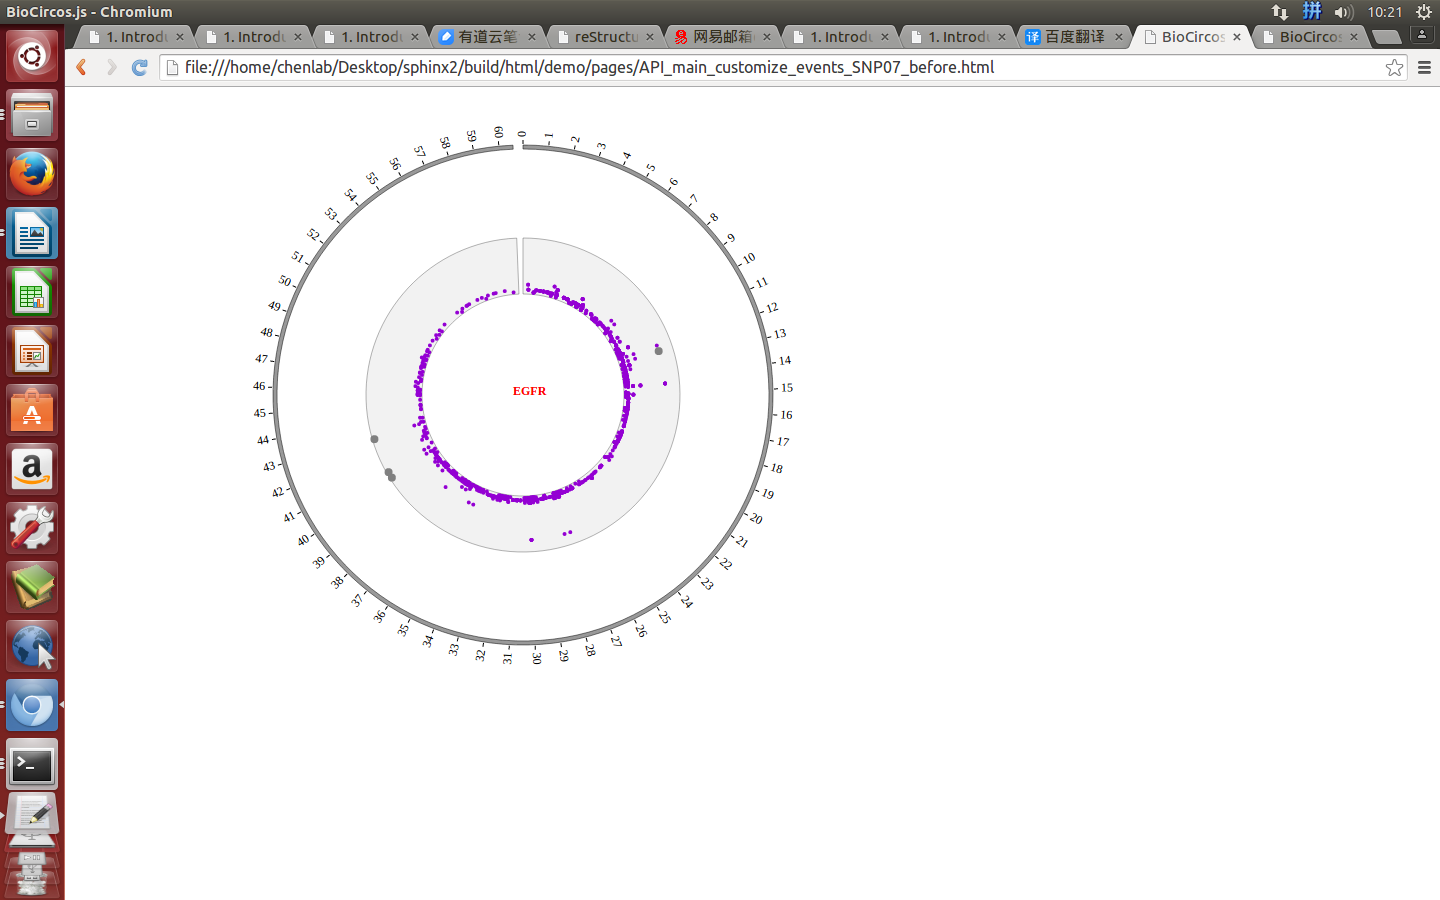
|

|
Mouse over
SNPMouseOverDisplaydefault false, [true/false], open/not open mouse mouse Over event of SNP module
SNPMouseOverColordefault “red”, “none” means no change, element change color after mouse Over the element
SNPMouseOverCircleSizedefault 2, “none” means no change, element change circle size after mouse Over the element.
SNPMouseOverCircleOpacitydefault 1.0, “none” means no change, element change opacity after mouse Over the element
SNPMouseOverCircleStrokeColordefault “#F26223”, “none” means no change, element change stroke color after mouse Over the element.
SNPMouseOverCircleStrokeWidthdefault 3, “none” means no change, element change stroke width after mouse Over the element.
Example: change size and color of the circle when mouse over the element;
| Example | Before | After |
|---|---|---|
| Code change | SNPMouseOverColor : "red",
SNPMouseOverCircleSize : 4,
|
SNPMouseOverColor : "none",
SNPMouseOverCircleSize : "none",
|
| Image change | 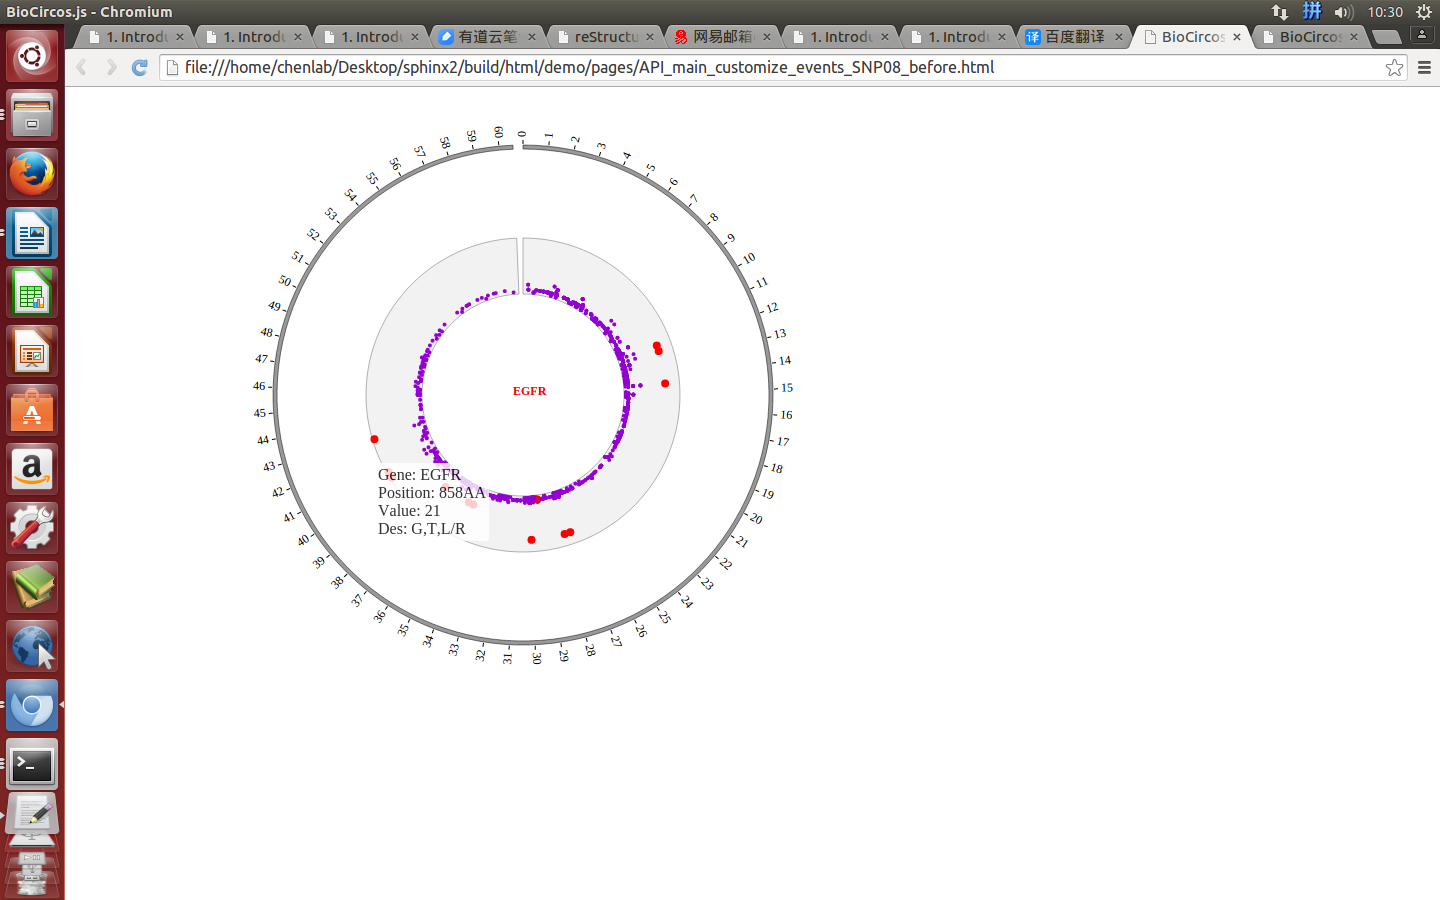
|
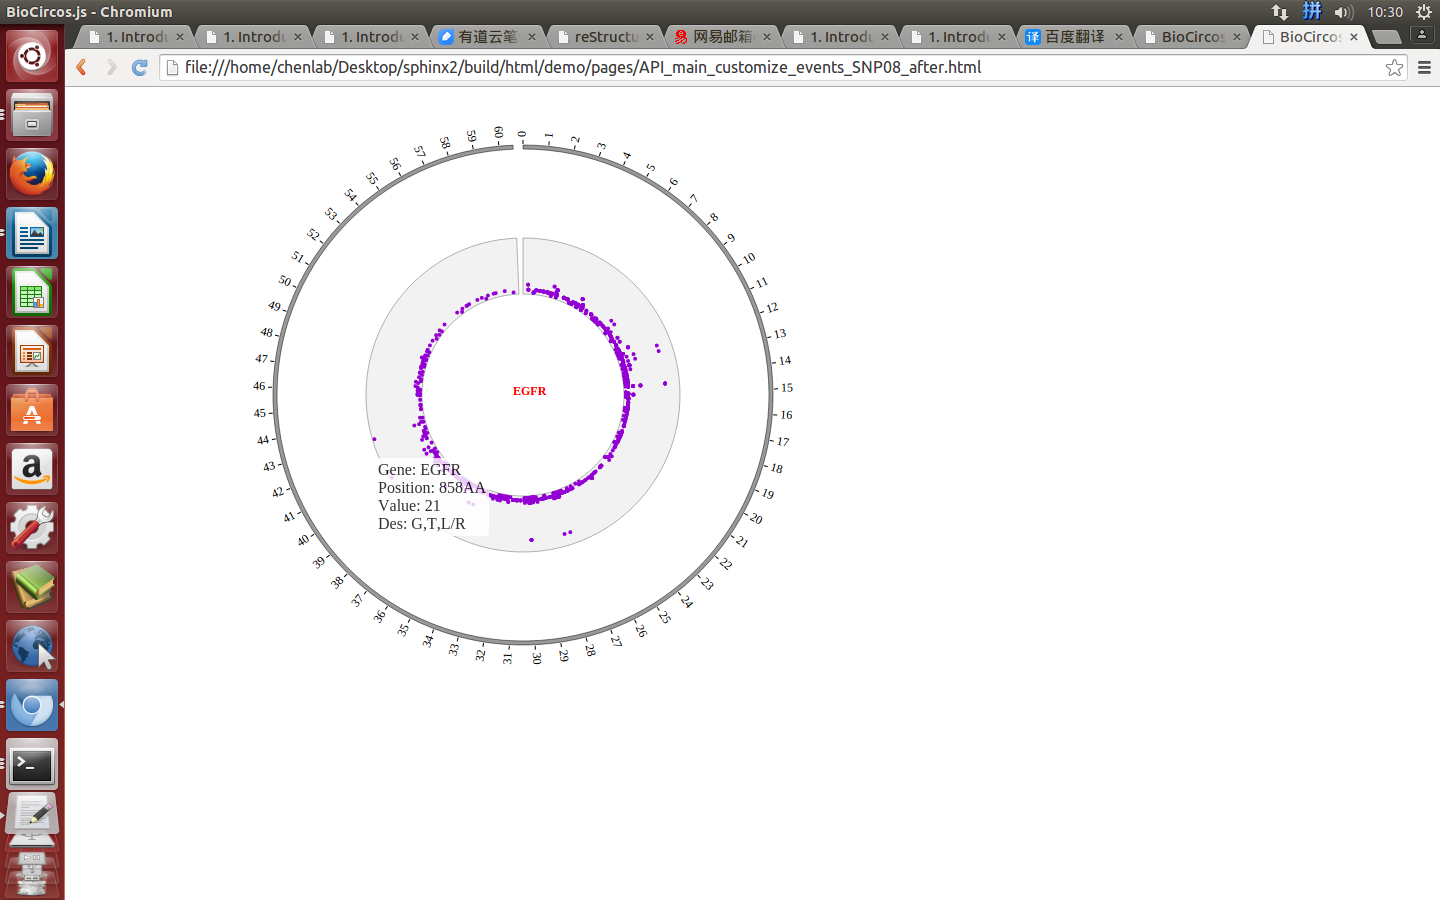
|
SCATTER module
(1)All configuration parameters
Here we show all the configuration parameters in SCATTER module of Customize Events class.
BioCircos01 = new BioCircos(BioCircosGenome,{
   // Main configuration - Customize events - SCATTER module
   SCATTERMouseEvent : true,
   SCATTERMouseClickDisplay : false,
   SCATTERMouseClickColor : "red",
   SCATTERMouseClickCircleSize : 4,
   SCATTERMouseClickCircleOpacity : 1.0,
   SCATTERMouseClickCircleStrokeColor : "#F26223",
   SCATTERMouseClickCircleStrokeWidth : 0,
   SCATTERMouseClickTextFromData : "fourth",
   SCATTERMouseClickTextOpacity : 1,
   SCATTERMouseClickTextColor : "red",
   SCATTERMouseClickTextSize : 8,
   SCATTERMouseClickTextPostionX : 1.0,
   SCATTERMouseClickTextPostionY : 10.0,
   SCATTERMouseClickTextDrag : true,
   SCATTERMouseDownDisplay : false,
   SCATTERMouseDownColor : "green",
   SCATTERMouseDownCircleSize : 4,
   SCATTERMouseDownCircleOpacity : 1.0,
   SCATTERMouseDownCircleStrokeColor : "#F26223",
   SCATTERMouseDownCircleStrokeWidth : 0,
   SCATTERMouseEnterDisplay : false,
   SCATTERMouseEnterColor : "yellow",
   SCATTERMouseEnterCircleSize : 4,
   SCATTERMouseEnterCircleOpacity : 1.0,
   SCATTERMouseEnterCircleStrokeColor : "#F26223",
   SCATTERMouseEnterCircleStrokeWidth : 0,
   SCATTERMouseLeaveDisplay : false,
   SCATTERMouseLeaveColor : "pink",
   SCATTERMouseLeaveCircleSize : 4,
   SCATTERMouseLeaveCircleOpacity : 1.0,
   SCATTERMouseLeaveCircleStrokeColor : "#F26223",
   SCATTERMouseLeaveCircleStrokeWidth : 0,
   SCATTERMouseMoveDisplay : false,
   SCATTERMouseMoveColor : "red",
   SCATTERMouseMoveCircleSize : 2,
   SCATTERMouseMoveCircleOpacity : 1.0,
   SCATTERMouseMoveCircleStrokeColor : "#F26223",
   SCATTERMouseMoveCircleStrokeWidth : 0,
   SCATTERMouseOutDisplay : false,
   SCATTERMouseOutAnimationTime : 500,
   SCATTERMouseOutColor : "red",
   SCATTERMouseOutCircleSize : 2,
   SCATTERMouseOutCircleOpacity : 1.0,
   SCATTERMouseOutCircleStrokeColor : "red",
   SCATTERMouseOutCircleStrokeWidth : 0,
   SCATTERMouseUpDisplay : false,
   SCATTERMouseUpColor : "grey",
   SCATTERMouseUpCircleSize : 4,
   SCATTERMouseUpCircleOpacity : 1.0,
   SCATTERMouseUpCircleStrokeColor : "#F26223",
   SCATTERMouseUpCircleStrokeWidth : 0,
   SCATTERMouseOverDisplay : false,
   SCATTERMouseOverColor : "red",
   SCATTERMouseOverCircleSize : 2,
   SCATTERMouseOverCircleOpacity : 1.0,
   SCATTERMouseOverCircleStrokeColor : "#F26223",
   SCATTERMouseOverCircleStrokeWidth : 3,
});
(2)Configuration and examples
SCATTERMouseEventdefault true, [true/false], open/not open mouse event of SCATTER module
Mouse click
SCATTERMouseClickDisplaydefault true, [true/false], open/not open mouse click event of SCATTER module
SCATTERMouseClickColordefault “red”, “none” means no change, element change color after click the element
SCATTERMouseClickCircleSizedefault 4, “none” means no change, element change circle size after click the element.
SCATTERMouseClickCircleOpacitydefault 1.0, “none” means no change, element change opacity after click the element
SCATTERMouseClickCircleStrokeColordefault “#F26223”, “none” means no change, element change stroke color after click the element.
SCATTERMouseClickCircleStrokeWidthdefault 0, “none” means no change, element change stroke width after click the element.
SCATTERMouseClickTextFromDatadefault “fourth”, first,second,third,fourth column data click to show
SCATTERMouseClickTextOpacitydefault 1.0, text opacity after click the element
SCATTERMouseClickTextColordefault “red”, text color after click the element
SCATTERMouseClickTextSizedefault 8, text size after click the element
SCATTERMouseClickTextPostionXdefault 1.0, text x position after click the element
SCATTERMouseClickTextPostionYdefault 10.0, text y position after click the element
SCATTERMouseClickTextDragdefault true, [true/false], open/not open text drag function
Mouse down
SCATTERMouseDownDisplaydefault false, [true/false], open/not open mouse mouse down event of SCATTER module
SCATTERMouseDownColordefault “green”, “none” means no change, element change color after mouse down the element
SCATTERMouseDownCircleSizedefault 4, “none” means no change, element change circle size after mouse down the element.
SCATTERMouseDownCircleOpacitydefault 1.0, “none” means no change, element change opacity after mouse down the element
SCATTERMouseDownCircleStrokeColordefault “#F26223”, “none” means no change, element change stroke color after mouse down the element.
SCATTERMouseDownCircleStrokeWidthdefault 0, “none” means no change, element change stroke width after mouse down the element.
Mouse enter
SCATTERMouseEnterDisplaydefault false, [true/false], open/not open mouse mouse enter event of SCATTER module
SCATTERMouseEnterColordefault “yellow”, “none” means no change, element change color after mouse enter the element
SCATTERMouseEnterCircleSizedefault 4, “none” means no change, element change circle size after mouse enter the element.
SCATTERMouseEnterCircleOpacitydefault 1.0, “none” means no change, element change opacity after mouse enter the element
SCATTERMouseEnterCircleStrokeColordefault “#F26223”, “none” means no change, element change stroke color after mouse enter the element.
SCATTERMouseEnterCircleStrokeWidthdefault 0, “none” means no change, element change stroke width after mouse enter the element.
Mouse leave
SCATTERMouseLeaveDisplaydefault false, [true/false], open/not open mouse mouse leave event of SCATTER module
SCATTERMouseLeaveColordefault “pink”, “none” means no change, element change color after mouse leave the element
SCATTERMouseLeaveCircleSizedefault 4, “none” means no change, element change circle size after mouse leave the element.
SCATTERMouseLeaveCircleOpacitydefault 1.0, “none” means no change, element change opacity after mouse leave the element
SCATTERMouseLeaveCircleStrokeColordefault “#F26223”, “none” means no change, element change stroke color after mouse leave the element.
SCATTERMouseLeaveCircleStrokeWidthdefault 0, “none” means no change, element change stroke width after mouse leave the element.
Mouse move
SCATTERMouseMoveDisplaydefault false, [true/false], open/not open mouse mouse move event of SCATTER module
SCATTERMouseMoveColordefault “red”, “none” means no change, element change color after mouse move the element
SCATTERMouseMoveCircleSizedefault 2, “none” means no change, element change circle size after mouse move the element.
SCATTERMouseMoveCircleOpacitydefault 1.0, “none” means no change, element change opacity after mouse move the element
SCATTERMouseMoveCircleStrokeColordefault “#F26223”, “none” means no change, element change stroke color after mouse move the element.
SCATTERMouseMoveCircleStrokeWidthdefault 0, “none” means no change, element change stroke width after mouse move the element.
Mouse out
SCATTERMouseOutDisplaydefault false, [true/false], open/not open mouse mouse out event of SCATTER module
SCATTERMouseOutAnimationTimedefault 500, animation time after mouse out the element
SCATTERMouseOutColordefault “red”, “none” means no change, element change color after mouse out the element
SCATTERMouseOutCircleSizedefault 2, “none” means no change, element change circle size after mouse out the element.
SCATTERMouseOutCircleOpacitydefault 1.0, “none” means no change, element change opacity after mouse out the element
SCATTERMouseOutCircleStrokeColordefault “red”, “none” means no change, element change stroke color after mouse out the element.
SCATTERMouseOutCircleStrokeWidthdefault 0, “none” means no change, element change stroke width after mouse out the element.
Mouse up
SCATTERMouseUpDisplaydefault false, [true/false], open/not open mouse mouse up event of SCATTER module
SCATTERMouseUpColordefault “grey”, “none” means no change, element change color after mouse up the element
SCATTERMouseUpCircleSizedefault 4, “none” means no change, element change circle size after mouse up the element.
SCATTERMouseUpCircleOpacitydefault 1.0, “none” means no change, element change opacity after mouse up the element
SCATTERMouseUpCircleStrokeColordefault “#F26223”, “none” means no change, element change stroke color after mouse up the element.
SCATTERMouseUpCircleStrokeWidthdefault 0, “none” means no change, element change stroke width after mouse up the element.
Mouse over
SCATTERMouseOverDisplaydefault false, [true/false], open/not open mouse mouse Over event of SCATTER module
SCATTERMouseOverColordefault “red”, “none” means no change, element change color after mouse Over the element
SCATTERMouseOverCircleSizedefault 2, “none” means no change, element change circle size after mouse Over the element.
SCATTERMouseOverCircleOpacitydefault 1.0, “none” means no change, element change opacity after mouse Over the element
SCATTERMouseOverCircleStrokeColordefault “#F26223”, “none” means no change, element change stroke color after mouse Over the element.
SCATTERMouseOverCircleStrokeWidthdefault 3, “none” means no change, element change stroke width after mouse Over the element.
LINK module
(1)All configuration parameters
Here we show all the configuration parameters in LINK module of Customize Events class.
BioCircos01 = new BioCircos(BioCircosGenome,{
   // Main configuration - Customize events - LINK module
   LINKMouseEvent : true,
   LINKMouseClickDisplay : false,
   LINKMouseClickOpacity : 1.0,
   LINKMouseClickStrokeColor : "green",
   LINKMouseClickStrokeWidth : 4,
   LINKMouseDownDisplay : false,
   LINKMouseDownOpacity : 1.0,
   LINKMouseDownStrokeColor : "#F26223",
   LINKMouseDownStrokeWidth : 4,
   LINKMouseEnterDisplay : false,
   LINKMouseEnterOpacity : 1.0,
   LINKMouseEnterStrokeColor : "#F26223",
   LINKMouseEnterStrokeWidth : 4,
   LINKMouseLeaveDisplay : false,
   LINKMouseLeaveOpacity : 1.0,
   LINKMouseLeaveStrokeColor : "#F26223",
   LINKMouseLeaveStrokeWidth : 4,
   LINKMouseMoveDisplay : false,
   LINKMouseMoveOpacity : 1.0,
   LINKMouseMoveStrokeColor : "#F26223",
   LINKMouseMoveStrokeWidth : 4,
   LINKMouseOutDisplay : false,
   LINKMouseOutAnimationTime : 500,
   LINKMouseOutOpacity : 1.0,
   LINKMouseOutStrokeColor : "red",
   LINKMouseOutStrokeWidth : 4,
   LINKMouseUpDisplay : false,
   LINKMouseUpOpacity : 1.0,
   LINKMouseUpStrokeColor : "#F26223",
   LINKMouseUpStrokeWidth : 4,
   LINKLabelDragEvent : false,
});
(2)Configuration and examples
LINKMouseEventdefault true, [true/false], open/not open mouse event of LINK module
Mouse click
LINKMouseClickDisplaydefault true, [true/false], open/not open mouse click event of LINK module
LINKMouseClickOpacitydefault 1.0, “none” means no change, element change opacity after click the element
LINKMouseClickStrokeColordefault “green”, “none” means no change, element change color after click the element
LINKMouseClickStrokeWidthdefault 4, “none” means no change, element change stroke width after click the element.
Mouse down
LINKMouseDownDisplaydefault false, [true/false], open/not open mouse mouse down event of LINK module
LINKMouseDownOpacitydefault 1.0, “none” means no change, element change opacity after mouse down the element
LINKMouseDownStrokeColordefault “#F26223”, “none” means no change, element change color after mouse down the element
LINKMouseDownStrokeWidthdefault 4, “none” means no change, element change stroke width after mouse down the element.
Mouse enter
LINKMouseEnterDisplaydefault false, [true/false], open/not open mouse mouse enter event of LINK module
LINKMouseEnterOpacitydefault 1.0, “none” means no change, element change opacity after mouse enter the element
LINKMouseEnterStrokeColordefault “#F26223”, “none” means no change, element change color after mouse enter the element
LINKMouseEnterStrokeWidthdefault 4, “none” means no change, element change stroke width after mouse enter the element.
Mouse leave
LINKMouseLeaveDisplaydefault false, [true/false], open/not open mouse mouse leave event of LINK module
LINKMouseLeaveOpacitydefault 1.0, “none” means no change, element change opacity after mouse leave the element
LINKMouseLeaveStrokeColordefault “#F26223”, “none” means no change, element change color after mouse leave the element
LINKMouseLeaveStrokeWidthdefault 4, “none” means no change, element change stroke width after mouse leave the element.
Mouse move
LINKMouseMoveDisplaydefault false, [true/false], open/not open mouse mouse move event of LINK module
LINKMouseMoveOpacitydefault 1.0, “none” means no change, element change opacity after mouse move the element
LINKMouseMoveStrokeColordefault “#F26223”, “none” means no change, element change color after mouse move the element
LINKMouseMoveStrokeWidthdefault 4, “none” means no change, element change stroke width after mouse move the element.
Mouse out
LINKMouseOutDisplaydefault false, [true/false], open/not open mouse mouse out event of LINK module
LINKMouseOutAnimationTimedefault 500, animation time after mouse out the element
LINKMouseOutOpacitydefault 1.0, “none” means no change, element change opacity after mouse out the element
LINKMouseOutStrokeColordefault “red”, “none” means no change, element change color after mouse out the element
LINKMouseOutStrokeWidthdefault 4, “none” means no change, element change stroke width after mouse out the element.
Mouse up
LINKMouseUpDisplaydefault false, [true/false], open/not open mouse mouse up event of LINK module
LINKMouseUpOpacitydefault 1.0, “none” means no change, element change opacity after mouse up the element
LINKMouseUpStrokeColordefault “#F26223”, “none” means no change, element change color after mouse up the element
LINKMouseUpStrokeWidthdefault 4, “none” means no change, element change stroke width after mouse up the element.
Mouse over
LINKMouseOverDisplaydefault true, [true/false], open/not open mouse mouse over event of LINK module
LINKMouseOverOpacitydefault 1.0, “none” means no change, element change opacity after mouse over the element
LINKMouseOverStrokeColordefault “#F26223”, “none” means no change, element change color after mouse over the element
LINKMouseOverStrokeWidthdefault 3, “none” means no change, element change stroke width after mouse over the element.
LINK Label Drag Event
LINKLabelDragEventdefault false, [true/false], open/not open lINK label drag event
CNV module
(1)All configuration parameters
Here we show all the configuration parameters in CNV module of Customize Events class.
BioCircos01 = new BioCircos(BioCircosGenome,{
   // Main configuration - Customize events - CNV module
   CNVMouseEvent : true,
   CNVMouseClickDisplay : false,
   CNVMouseClickColor : "red",
   CNVMouseClickArcOpacity : 1.0,
   CNVMouseClickArcStrokeColor : "#F26223",
   CNVMouseClickArcStrokeWidth : 0,
   CNVMouseClickTextFromData : "fourth",   //first,second,third,fourth column
   CNVMouseClickTextOpacity : 1,
   CNVMouseClickTextColor : "red",
   CNVMouseClickTextSize : 8,
   CNVMouseClickTextPostionX : 0,
   CNVMouseClickTextPostionY : 0,
   CNVMouseClickTextDrag : true,
   CNVMouseDownDisplay : false,
   CNVMouseDownColor : "green",
   CNVMouseDownArcOpacity : 1.0,
   CNVMouseDownArcStrokeColor : "#F26223",
   CNVMouseDownArcStrokeWidth : 0,
   CNVMouseEnterDisplay : false,
   CNVMouseEnterColor : "yellow",
   CNVMouseEnterArcOpacity : 1.0,
   CNVMouseEnterArcStrokeColor : "#F26223",
   CNVMouseEnterArcStrokeWidth : 0,
   CNVMouseLeaveDisplay : false,
   CNVMouseLeaveColor : "pink",
   CNVMouseLeaveArcOpacity : 1.0,
   CNVMouseLeaveArcStrokeColor : "#F26223",
   CNVMouseLeaveArcStrokeWidth : 0,
   CNVMouseMoveDisplay : false,
   CNVMouseMoveColor : "red",
   CNVMouseMoveArcOpacity : 1.0,
   CNVMouseMoveArcStrokeColor : "#F26223",
   CNVMouseMoveArcStrokeWidth : 0,
   CNVMouseOutDisplay : false,
   CNVMouseOutAnimationTime : 500,
   CNVMouseOutColor : "red",
   CNVMouseOutArcOpacity : 1.0,
   CNVMouseOutArcStrokeColor : "red",
   CNVMouseOutArcStrokeWidth : 0,
   CNVMouseUpDisplay : false,
   CNVMouseUpColor : "grey",
   CNVMouseUpArcOpacity : 1.0,
   CNVMouseUpArcStrokeColor : "#F26223",
   CNVMouseUpArcStrokeWidth : 0,
   CNVMouseOverDisplay : false,
   CNVMouseOverColor : "red",
   CNVMouseOverArcOpacity : 1.0,
   CNVMouseOverArcStrokeColor : "#F26223",
   CNVMouseOverArcStrokeWidth : 3,
   CNVMouseOverTooltipsHtml01 : "chr : ",
   CNVMouseOverTooltipsHtml02 : "<br>start : ",
   CNVMouseOverTooltipsHtml03 : "<br>end : ",
   CNVMouseOverTooltipsHtml04 : "<br>value : ",
   CNVMouseOverTooltipsHtml05 : "",
   CNVMouseOverTooltipsPosition : "absolute",
   CNVMouseOverTooltipsBackgroundColor : "white",
   CNVMouseOverTooltipsBorderStyle : "solid",
   CNVMouseOverTooltipsBorderWidth : 0,
   CNVMouseOverTooltipsPadding : "3px",
   CNVMouseOverTooltipsBorderRadius : "3px",
   CNVMouseOverTooltipsOpacity : 0.8,
});
(2)Configuration and examples
CNVMouseEventdefault true, [true/false], open/not open mouse event of CNV module
Mouse click
CNVMouseClickDisplaydefault true, [true/false], open/not open mouse click event of CNV module
CNVMouseClickColordefault “red”, “none” means no change, element change color after click the element
CNVMouseClickArcOpacitydefault 1.0, “none” means no change, element change opacity after click the element
CNVMouseClickArcStrokeColordefault “#F26223”, “none” means no change, element change stroke color after click the element.
CNVMouseClickArcStrokeWidthdefault 0, “none” means no change, element change stroke width after click the element.
CNVMouseClickTextFromDatadefault “fourth”, first,second,third,fourth column data click to show
CNVMouseClickTextOpacitydefault 1.0, text opacity after click the element
CNVMouseClickTextColordefault “red”, text color after click the element
CNVMouseClickTextSizedefault 8, text size after click the element
CNVMouseClickTextPostionXdefault 0, text x position after click the element
CNVMouseClickTextPostionYdefault 0, text y position after click the element
CNVMouseClickTextDragdefault true, [true/false], open/not open text drag function
Mouse down
CNVMouseDownDisplaydefault false, [true/false], open/not open mouse mouse down event of CNV module
CNVMouseDownColordefault “green”, “none” means no change, element change color after mouse down the element
CNVMouseDownArcOpacitydefault 1.0, “none” means no change, element change opacity after mouse down the element
CNVMouseDownArcStrokeColordefault “#F26223”, “none” means no change, element change stroke color after mouse down the element.
CNVMouseDownArcStrokeWidthdefault 0, “none” means no change, element change stroke width after mouse down the element.
Mouse enter
CNVMouseEnterDisplaydefault false, [true/false], open/not open mouse mouse enter event of CNV module
CNVMouseEnterColordefault “yellow”, “none” means no change, element change color after mouse enter the element
CNVMouseEnterArcOpacitydefault 1.0, “none” means no change, element change opacity after mouse enter the element
CNVMouseEnterArcStrokeColordefault “#F26223”, “none” means no change, element change stroke color after mouse enter the element.
CNVMouseEnterArcStrokeWidthdefault 0, “none” means no change, element change stroke width after mouse enter the element.
Mouse leave
CNVMouseLeaveDisplaydefault false, [true/false], open/not open mouse mouse leave event of CNV module
CNVMouseLeaveColordefault “pink”, “none” means no change, element change color after mouse leave the element
CNVMouseLeaveArcOpacitydefault 1.0, “none” means no change, element change opacity after mouse leave the element
CNVMouseLeaveArcStrokeColordefault “#F26223”, “none” means no change, element change stroke color after mouse leave the element.
CNVMouseLeaveArcStrokeWidthdefault 0, “none” means no change, element change stroke width after mouse leave the element.
Mouse move
CNVMouseMoveDisplaydefault false, [true/false], open/not open mouse mouse move event of CNV module
CNVMouseMoveColordefault “red”, “none” means no change, element change color after mouse move the element
CNVMouseMoveArcOpacitydefault 1.0, “none” means no change, element change opacity after mouse move the element
CNVMouseMoveArcStrokeColordefault “#F26223”, “none” means no change, element change stroke color after mouse move the element.
CNVMouseMoveArcStrokeWidthdefault 0, “none” means no change, element change stroke width after mouse move the element.
Mouse out
CNVMouseOutDisplaydefault false, [true/false], open/not open mouse mouse out event of CNV module
CNVMouseOutAnimationTimedefault 500, animation time after mouse out the element
CNVMouseOutColordefault “red”, “none” means no change, element change color after mouse out the element
CNVMouseOutArcOpacitydefault 1.0, “none” means no change, element change opacity after mouse out the element
CNVMouseOutArcStrokeColordefault “red”, “none” means no change, element change stroke color after mouse out the element.
CNVMouseOutArcStrokeWidthdefault 0, “none” means no change, element change stroke width after mouse out the element.
Mouse up
CNVMouseUpDisplaydefault false, [true/false], open/not open mouse mouse up event of CNV module
CNVMouseUpColordefault “grey”, “none” means no change, element change color after mouse up the element
CNVMouseUpArcOpacitydefault 1.0, “none” means no change, element change opacity after mouse up the element
CNVMouseUpArcStrokeColordefault “#F26223”, “none” means no change, element change stroke color after mouse up the element.
CNVMouseUpArcStrokeWidthdefault 0, “none” means no change, element change stroke width after mouse up the element.
Mouse over
CNVMouseOverDisplaydefault false, [true/false], open/not open mouse mouse Over event of CNV module
CNVMouseOverColordefault “red”, “none” means no change, element change color after mouse Over the element
CNVMouseOverArcOpacitydefault 1.0, “none” means no change, element change opacity after mouse Over the element
CNVMouseOverArcStrokeColordefault “#F26223”, “none” means no change, element change stroke color after mouse Over the element.
CNVMouseOverArcStrokeWidthdefault 3, “none” means no change, element change stroke width after mouse Over the element.
ARC module
(1)All configuration parameters
Here we show all the configuration parameters in ARC module of Customize Events class.
BioCircos01 = new BioCircos(BioCircosGenome,{
   // Main configuration - Customize events - ARC module
   ARCMouseEvent : true,
   ARCMouseClickDisplay : false,
   ARCMouseClickColor : "red",
   ARCMouseClickArcOpacity : 1.0,
   ARCMouseClickArcStrokeColor : "#F26223",
   ARCMouseClickArcStrokeWidth : 1,
   ARCMouseClickTextFromData : "fourth",
   ARCMouseClickTextOpacity : 1,
   ARCMouseClickTextColor : "red",
   ARCMouseClickTextSize : 8,
   ARCMouseClickTextPostionX : 0,
   ARCMouseClickTextPostionY : 0,
   ARCMouseClickTextDrag : true,
   ARCMouseDownDisplay : false,
   ARCMouseDownColor : "green",
   ARCMouseDownArcOpacity : 1.0,
   ARCMouseDownArcStrokeColor : "#F26223",
   ARCMouseDownArcStrokeWidth : 0,
   ARCMouseEnterDisplay : false,
   ARCMouseEnterColor : "yellow",
   ARCMouseEnterArcOpacity : 1.0,
   ARCMouseEnterArcStrokeColor : "#F26223",
   ARCMouseEnterArcStrokeWidth : 0,
   ARCMouseLeaveDisplay : false,
   ARCMouseLeaveColor : "pink",
   ARCMouseLeaveArcOpacity : 1.0,
   ARCMouseLeaveArcStrokeColor : "#F26223",
   ARCMouseLeaveArcStrokeWidth : 0,
   ARCMouseMoveDisplay : false,
   ARCMouseMoveColor : "red",
   ARCMouseMoveArcOpacity : 1.0,
   ARCMouseMoveArcStrokeColor : "#F26223",
   ARCMouseMoveArcStrokeWidth : 0,
   ARCMouseOutDisplay : false,
   ARCMouseOutAnimationTime : 500,
   ARCMouseOutColor : "red",
   ARCMouseOutArcOpacity : 1.0,
   ARCMouseOutArcStrokeColor : "red",
   ARCMouseOutArcStrokeWidth : 0,
   ARCMouseUpDisplay : false,
   ARCMouseUpColor : "grey",
   ARCMouseUpArcOpacity : 1.0,
   ARCMouseUpArcStrokeColor : "#F26223",
   ARCMouseUpArcStrokeWidth : 0,
   ARCMouseOverDisplay : false,
   ARCMouseOverColor : "red",
   ARCMouseOverArcOpacity : 1.0,
   ARCMouseOverArcStrokeColor : "#F26223",
   ARCMouseOverArcStrokeWidth : 3,
});
(2)Configuration and examples
ARCMouseEventdefault false, [true/false], open/not open mouse event of ARC module
Mouse click
ARCMouseClickDisplaydefault true, [true/false], open/not open mouse click event of ARC module
ARCMouseClickColordefault “red”, “none” means no change, element change color after click the element
ARCMouseClickArcOpacitydefault 1.0, “none” means no change, element change opacity after click the element
ARCMouseClickArcStrokeColordefault “#F26223”, “none” means no change, element change stroke color after click the element.
ARCMouseClickArcStrokeWidthdefault 1, “none” means no change, element change stroke width after click the element.
ARCMouseClickTextFromDatadefault “fourth”, first,second,third,fourth column data click to show
ARCMouseClickTextOpacitydefault 1.0, text opacity after click the element
ARCMouseClickTextColordefault “red”, text color after click the element
ARCMouseClickTextSizedefault 8, text size after click the element
ARCMouseClickTextPostionXdefault 0, text x position after click the element
ARCMouseClickTextPostionYdefault 0, text y position after click the element
ARCMouseClickTextDragdefault true, [true/false], open/not open text drag function
Mouse down
ARCMouseDownDisplaydefault false, [true/false], open/not open mouse mouse down event of ARC module
ARCMouseDownColordefault “green”, “none” means no change, element change color after mouse down the element
ARCMouseDownArcOpacitydefault 1.0, “none” means no change, element change opacity after mouse down the element
ARCMouseDownArcStrokeColordefault “#F26223”, “none” means no change, element change stroke color after mouse down the element.
ARCMouseDownArcStrokeWidthdefault 0, “none” means no change, element change stroke width after mouse down the element.
Mouse enter
ARCMouseEnterDisplaydefault false, [true/false], open/not open mouse mouse enter event of ARC module
ARCMouseEnterColordefault “yellow”, “none” means no change, element change color after mouse enter the element
ARCMouseEnterArcOpacitydefault 1.0, “none” means no change, element change opacity after mouse enter the element
ARCMouseEnterArcStrokeColordefault “#F26223”, “none” means no change, element change stroke color after mouse enter the element.
ARCMouseEnterArcStrokeWidthdefault 0, “none” means no change, element change stroke width after mouse enter the element.
Mouse leave
ARCMouseLeaveDisplaydefault false, [true/false], open/not open mouse mouse leave event of ARC module
ARCMouseLeaveColordefault “pink”, “none” means no change, element change color after mouse leave the element
ARCMouseLeaveArcOpacitydefault 1.0, “none” means no change, element change opacity after mouse leave the element
ARCMouseLeaveArcStrokeColordefault “#F26223”, “none” means no change, element change stroke color after mouse leave the element.
ARCMouseLeaveArcStrokeWidthdefault 0, “none” means no change, element change stroke width after mouse leave the element.
Mouse move
ARCMouseMoveDisplaydefault false, [true/false], open/not open mouse mouse move event of ARC module
ARCMouseMoveColordefault “red”, “none” means no change, element change color after mouse move the element
ARCMouseMoveArcOpacitydefault 1.0, “none” means no change, element change opacity after mouse move the element
ARCMouseMoveArcStrokeColordefault “#F26223”, “none” means no change, element change stroke color after mouse move the element.
ARCMouseMoveArcStrokeWidthdefault 0, “none” means no change, element change stroke width after mouse move the element.
Mouse out
ARCMouseOutDisplaydefault false, [true/false], open/not open mouse mouse out event of ARC module
ARCMouseOutAnimationTimedefault 500, animation time after mouse out the element
ARCMouseOutColordefault “red”, “none” means no change, element change color after mouse out the element
ARCMouseOutArcOpacitydefault 1.0, “none” means no change, element change opacity after mouse out the element
ARCMouseOutArcStrokeColordefault “red”, “none” means no change, element change stroke color after mouse out the element.
ARCMouseOutArcStrokeWidthdefault 0, “none” means no change, element change stroke width after mouse out the element.
Mouse up
ARCMouseUpDisplaydefault false, [true/false], open/not open mouse mouse up event of ARC module
ARCMouseUpColordefault “grey”, “none” means no change, element change color after mouse up the element
ARCMouseUpArcOpacitydefault 1.0, “none” means no change, element change opacity after mouse up the element
ARCMouseUpArcStrokeColordefault “#F26223”, “none” means no change, element change stroke color after mouse up the element.
ARCMouseUpArcStrokeWidthdefault 0, “none” means no change, element change stroke width after mouse up the element.
Mouse over
ARCMouseOverDisplaydefault false, [true/false], open/not open mouse mouse Over event of ARC module
ARCMouseOverColordefault “red”, “none” means no change, element change color after mouse Over the element
ARCMouseOverArcOpacitydefault 1.0, “none” means no change, element change opacity after mouse Over the element
ARCMouseOverArcStrokeColordefault “#F26223”, “none” means no change, element change stroke color after mouse Over the element.
ARCMouseOverArcStrokeWidthdefault 3, “none” means no change, element change stroke width after mouse Over the element.
HEATMAP module
(1)All configuration parameters
Here we show all the configuration parameters in HEATMAP module of Customize Events class.
BioCircos01 = new BioCircos(BioCircosGenome,{
   // Main configuration - Customize events - HEATMAP module
   HEATMAPMouseEvent : true,
   HEATMAPMouseClickDisplay : false,
   HEATMAPMouseClickColor : "green",            //"none","red"
   HEATMAPMouseClickOpacity : 1.0,            //"none",1.0
   HEATMAPMouseClickStrokeColor : "none",  //"none","#F26223"
   HEATMAPMouseClickStrokeWidth : "none",          //"none",3
   HEATMAPMouseDownDisplay : false,
   HEATMAPMouseDownColor : "green",            //"none","red"
   HEATMAPMouseDownOpacity : 1.0,            //"none",1.0
   HEATMAPMouseDownStrokeColor : "none",  //"none","#F26223"
   HEATMAPMouseDownStrokeWidth : "none",          //"none",3
   HEATMAPMouseEnterDisplay : false,
   HEATMAPMouseEnterColor : "green",            //"none","red"
   HEATMAPMouseEnterOpacity : 1.0,            //"none",1.0
   HEATMAPMouseEnterStrokeColor : "none",  //"none","#F26223"
   HEATMAPMouseEnterStrokeWidth : "none",          //"none",3
   HEATMAPMouseLeaveDisplay : false,
   HEATMAPMouseLeaveColor : "green",            //"none","red"
   HEATMAPMouseLeaveOpacity : 1.0,            //"none",1.0
   HEATMAPMouseLeaveStrokeColor : "none",  //"none","#F26223"
   HEATMAPMouseLeaveStrokeWidth : "none",          //"none",3
   HEATMAPMouseMoveDisplay : false,
   HEATMAPMouseMoveColor : "green",            //"none","red"
   HEATMAPMouseMoveOpacity : 1.0,            //"none",1.0
   HEATMAPMouseMoveStrokeColor : "none",  //"none","#F26223"
   HEATMAPMouseMoveStrokeWidth : "none",          //"none",3
   HEATMAPMouseOutDisplay : false,
   HEATMAPMouseOutAnimationTime : 500,
   HEATMAPMouseOutColor : "green",            //"none","red"
   HEATMAPMouseOutOpacity : 1.0,            //"none",1.0
   HEATMAPMouseOutStrokeColor : "none",  //"none","#F26223"
   HEATMAPMouseOutStrokeWidth : "none",          //"none",3
   HEATMAPMouseUpDisplay : false,
   HEATMAPMouseUpColor : "green",            //"none","red"
   HEATMAPMouseUpOpacity : 1.0,            //"none",1.0
   HEATMAPMouseUpStrokeColor : "none",  //"none","#F26223"
   HEATMAPMouseUpStrokeWidth : "none",          //"none",3
   HEATMAPMouseOverDisplay : false,
   HEATMAPMouseOverColor : "none",            //"none","red"
   HEATMAPMouseOverOpacity : 1.0,            //"none",1.0
   HEATMAPMouseOverStrokeColor : "none",  //"none","#F26223"
   HEATMAPMouseOverStrokeWidth : "none",          //"none",3
});
(2)Configuration and examples
HEATMAPMouseEventdefault true, [true/false], open/not open mouse event of HEATMAP module
Mouse click
HEATMAPMouseClickDisplaydefault false, [true/false], open/not open mouse click event of HEATMAP module
HEATMAPMouseClickColordefault “green”, “none” means no change, element change color after click the element
HEATMAPMouseClickOpacitydefault 1.0, “none” means no change, element change opacity after click the element
HEATMAPMouseClickStrokeColordefault “none”, “none” means no change, element change stroke color after click the element.
HEATMAPMouseClickStrokeWidthdefault “none”, “none” means no change, element change stroke width after click the element.
Mouse down
HEATMAPMouseDownDisplaydefault false, [true/false], open/not open mouse mouse down event of HEATMAP module
HEATMAPMouseDownColordefault “green”, “none” means no change, element change color after mouse down the element
HEATMAPMouseDownOpacitydefault 1.0, “none” means no change, element change opacity after mouse down the element
HEATMAPMouseDownStrokeColordefault “none”, “none” means no change, element change stroke color after mouse down the element.
HEATMAPMouseDownStrokeWidthdefault “none”, “none” means no change, element change stroke width after mouse down the element.
Mouse enter
HEATMAPMouseEnterDisplaydefault false, [true/false], open/not open mouse mouse enter event of HEATMAP module
HEATMAPMouseEnterColordefault “green”, “none” means no change, element change color after mouse enter the element
HEATMAPMouseEnterOpacitydefault 1.0, “none” means no change, element change opacity after mouse enter the element
HEATMAPMouseEnterStrokeColordefault “none”, “none” means no change, element change stroke color after mouse enter the element.
HEATMAPMouseEnterStrokeWidthdefault “none”, “none” means no change, element change stroke width after mouse enter the element.
Mouse leave
HEATMAPMouseLeaveDisplaydefault false, [true/false], open/not open mouse mouse leave event of HEATMAP module
HEATMAPMouseLeaveColordefault “green”, “none” means no change, element change color after mouse leave the element
HEATMAPMouseLeaveOpacitydefault 1.0, “none” means no change, element change opacity after mouse leave the element
HEATMAPMouseLeaveStrokeColordefault “none”, “none” means no change, element change stroke color after mouse leave the element.
HEATMAPMouseLeaveStrokeWidthdefault “none”, “none” means no change, element change stroke width after mouse leave the element.
Mouse move
HEATMAPMouseMoveDisplaydefault false, [true/false], open/not open mouse mouse move event of HEATMAP module
HEATMAPMouseMoveColordefault “green”, “none” means no change, element change color after mouse move the element
HEATMAPMouseMoveOpacitydefault “none”, “none” means no change, element change opacity after mouse move the element
HEATMAPMouseMoveStrokeColordefault “none”, “none” means no change, element change stroke color after mouse move the element.
HEATMAPMouseMoveStrokeWidthdefault 0, “none” means no change, element change stroke width after mouse move the element.
Mouse out
HEATMAPMouseOutDisplaydefault false, [true/false], open/not open mouse mouse out event of HEATMAP module
HEATMAPMouseOutAnimationTimedefault 500, animation time after mouse out the element
HEATMAPMouseOutColordefault “green”, “none” means no change, element change color after mouse out the element
HEATMAPMouseOutOpacitydefault 1.0, “none” means no change, element change opacity after mouse out the element
HEATMAPMouseOutStrokeColordefault “none”, “none” means no change, element change stroke color after mouse out the element.
HEATMAPMouseOutStrokeWidthdefault “none”, “none” means no change, element change stroke width after mouse out the element.
Mouse up
HEATMAPMouseUpDisplaydefault false, [true/false], open/not open mouse mouse up event of HEATMAP module
HEATMAPMouseUpColordefault “green”, “none” means no change, element change color after mouse up the element
HEATMAPMouseUpOpacitydefault 1.0, “none” means no change, element change opacity after mouse up the element
HEATMAPMouseUpStrokeColordefault “none”, “none” means no change, element change stroke color after mouse up the element.
HEATMAPMouseUpStrokeWidthdefault “none”, “none” means no change, element change stroke width after mouse up the element.
Mouse over
HEATMAPMouseOverDisplaydefault true, [true/false], open/not open mouse mouse Over event of HEATMAP module
HEATMAPMouseOverColordefault “none”, “none” means no change, element change color after mouse Over the element
HEATMAPMouseOverOpacitydefault 1.0, “none” means no change, element change opacity after mouse Over the element
HEATMAPMouseOverStrokeColordefault “none”, “none” means no change, element change stroke color after mouse Over the element.
HEATMAPMouseOverStrokeWidthdefault “none”, “none” means no change, element change stroke width after mouse Over the element.
HISTOGRAM module
(1)All configuration parameters
Here we show all the configuration parameters in HISTOGRAM module of Customize Events class.
BioCircos01 = new BioCircos(BioCircosGenome,{
   // Main configuration - Customize events - HISTOGRAM module
   HISTOGRAMMouseEvent : true,
   HISTOGRAMMouseClickDisplay : false,
   HISTOGRAMMouseClickColor : "red",            //"none","red"
   HISTOGRAMMouseClickOpacity : 1.0,            //"none",1.0
   HISTOGRAMMouseClickStrokeColor : "none",  //"none","#F26223"
   HISTOGRAMMouseClickStrokeWidth : "none",          //"none",3
   HISTOGRAMMouseDownDisplay : false,
   HISTOGRAMMouseDownColor : "red",            //"none","red"
   HISTOGRAMMouseDownOpacity : 1.0,            //"none",1.0
   HISTOGRAMMouseDownStrokeColor : "none",  //"none","#F26223"
   HISTOGRAMMouseDownStrokeWidth : "none",          //"none",3
   HISTOGRAMMouseEnterDisplay : false,
   HISTOGRAMMouseEnterColor : "red",            //"none","red"
   HISTOGRAMMouseEnterOpacity : 1.0,            //"none",1.0
   HISTOGRAMMouseEnterStrokeColor : "none",  //"none","#F26223"
   HISTOGRAMMouseEnterStrokeWidth : "none",          //"none",3
   HISTOGRAMMouseLeaveDisplay : false,
   HISTOGRAMMouseLeaveColor : "red",            //"none","red"
   HISTOGRAMMouseLeaveOpacity : 1.0,            //"none",1.0
   HISTOGRAMMouseLeaveStrokeColor : "none",  //"none","#F26223"
   HISTOGRAMMouseLeaveStrokeWidth : "none",          //"none",3
   HISTOGRAMMouseMoveDisplay : false,
   HISTOGRAMMouseMoveColor : "red",            //"none","red"
   HISTOGRAMMouseMoveOpacity : 1.0,            //"none",1.0
   HISTOGRAMMouseMoveStrokeColor : "none",  //"none","#F26223"
   HISTOGRAMMouseMoveStrokeWidth : "none",          //"none",3
   HISTOGRAMMouseOutDisplay : false,
   HISTOGRAMMouseOutAnimationTime : 500,
   HISTOGRAMMouseOutColor : "red",            //"none","red"
   HISTOGRAMMouseOutOpacity : 1.0,            //"none",1.0
   HISTOGRAMMouseOutStrokeColor : "none",  //"none","#F26223"
   HISTOGRAMMouseOutStrokeWidth : "none",          //"none",3
   HISTOGRAMMouseUpDisplay : false,
   HISTOGRAMMouseUpColor : "red",            //"none","red"
   HISTOGRAMMouseUpOpacity : 1.0,            //"none",1.0
   HISTOGRAMMouseUpStrokeColor : "none",  //"none","#F26223"
   HISTOGRAMMouseUpStrokeWidth : "none",          //"none",3
   HISTOGRAMMouseOverDisplay : false,
   HISTOGRAMMouseOverColor : "red",            //"none","red"
   HISTOGRAMMouseOverOpacity : 1.0,            //"none",1.0
   HISTOGRAMMouseOverStrokeColor : "none",  //"none","#F26223"
   HISTOGRAMMouseOverStrokeWidth : "none",          //"none",3
});
(2)Configuration and examples
HISTOGRAMMouseEventdefault true, [true/false], open/not open mouse event of HISTOGRAM module
Mouse click
HISTOGRAMMouseClickDisplaydefault false, [true/false], open/not open mouse click event of HISTOGRAM module
HISTOGRAMMouseClickColordefault “red”, “none” means no change, element change color after click the element
HISTOGRAMMouseClickOpacitydefault 1.0, “none” means no change, element change opacity after click the element
HISTOGRAMMouseClickStrokeColordefault “none”, “none” means no change, element change stroke color after click the element.
HISTOGRAMMouseClickStrokeWidthdefault “none”, “none” means no change, element change stroke width after click the element.
Mouse down
HISTOGRAMMouseDownDisplaydefault false, [true/false], open/not open mouse mouse down event of HISTOGRAM module
HISTOGRAMMouseDownColordefault “red”, “none” means no change, element change color after mouse down the element
HISTOGRAMMouseDownOpacitydefault 1.0, “none” means no change, element change opacity after mouse down the element
HISTOGRAMMouseDownStrokeColordefault “none”, “none” means no change, element change stroke color after mouse down the element.
HISTOGRAMMouseDownStrokeWidthdefault “none”, “none” means no change, element change stroke width after mouse down the element.
Mouse enter
HISTOGRAMMouseEnterDisplaydefault false, [true/false], open/not open mouse mouse enter event of HISTOGRAM module
HISTOGRAMMouseEnterColordefault “red”, “none” means no change, element change color after mouse enter the element
HISTOGRAMMouseEnterOpacitydefault 1.0, “none” means no change, element change opacity after mouse enter the element
HISTOGRAMMouseEnterStrokeColordefault “none”, “none” means no change, element change stroke color after mouse enter the element.
HISTOGRAMMouseEnterStrokeWidthdefault “none”, “none” means no change, element change stroke width after mouse enter the element.
Mouse leave
HISTOGRAMMouseLeaveDisplaydefault false, [true/false], open/not open mouse mouse leave event of HISTOGRAM module
HISTOGRAMMouseLeaveColordefault “red”, “none” means no change, element change color after mouse leave the element
HISTOGRAMMouseLeaveOpacitydefault 1.0, “none” means no change, element change opacity after mouse leave the element
HISTOGRAMMouseLeaveStrokeColordefault “none”, “none” means no change, element change stroke color after mouse leave the element.
HISTOGRAMMouseLeaveStrokeWidthdefault “none”, “none” means no change, element change stroke width after mouse leave the element.
Mouse move
HISTOGRAMMouseMoveDisplaydefault false, [true/false], open/not open mouse mouse move event of HISTOGRAM module
HISTOGRAMMouseMoveColordefault “red”, “none” means no change, element change color after mouse move the element
HISTOGRAMMouseMoveOpacitydefault 1.0, “none” means no change, element change opacity after mouse move the element
HISTOGRAMMouseMoveStrokeColordefault “none”, “none” means no change, element change stroke color after mouse move the element.
HISTOGRAMMouseMoveStrokeWidthdefault 0, “none” means no change, element change stroke width after mouse move the element.
Mouse out
HISTOGRAMMouseOutDisplaydefault false, [true/false], open/not open mouse mouse out event of HISTOGRAM module
HISTOGRAMMouseOutAnimationTimedefault 500, animation time after mouse out the element
HISTOGRAMMouseOutColordefault “red”, “none” means no change, element change color after mouse out the element
HISTOGRAMMouseOutOpacitydefault 1.0, “none” means no change, element change opacity after mouse out the element
HISTOGRAMMouseOutStrokeColordefault “none”, “none” means no change, element change stroke color after mouse out the element.
HISTOGRAMMouseOutStrokeWidthdefault “none”, “none” means no change, element change stroke width after mouse out the element.
Mouse up
HISTOGRAMMouseUpDisplaydefault false, [true/false], open/not open mouse mouse up event of HISTOGRAM module
HISTOGRAMMouseUpColordefault “red”, “none” means no change, element change color after mouse up the element
HISTOGRAMMouseUpOpacitydefault 1.0, “none” means no change, element change opacity after mouse up the element
HISTOGRAMMouseUpStrokeColordefault “none”, “none” means no change, element change stroke color after mouse up the element.
HISTOGRAMMouseUpStrokeWidthdefault “none”, “none” means no change, element change stroke width after mouse up the element.
Mouse over
HISTOGRAMMouseOverDisplaydefault true, [true/false], open/not open mouse mouse Over event of HISTOGRAM module
HISTOGRAMMouseOverColordefault “red”, “none” means no change, element change color after mouse Over the element
HISTOGRAMMouseOverOpacitydefault 1.0, “none” means no change, element change opacity after mouse Over the element
HISTOGRAMMouseOverStrokeColordefault “none”, “none” means no change, element change stroke color after mouse Over the element.
HISTOGRAMMouseOverStrokeWidthdefault “none”, “none” means no change, element change stroke width after mouse Over the element.
LINE module
(1)All configuration parameters
Here we show all the configuration parameters in LINE module of Customize Events class.
BioCircos01 = new BioCircos(BioCircosGenome,{
   // Main configuration - Customize events - LINE module
   LINEMouseEvent : true,
   LINEMouseClickDisplay : false,
   LINEMouseClickLineOpacity : 1,           //"none"
   LINEMouseClickLineStrokeColor : "red",   //"none"
   LINEMouseClickLineStrokeWidth : "none",  //"none"
   LINEMouseDownDisplay : false,
   LINEMouseDownLineOpacity : 1,           //"none"
   LINEMouseDownLineStrokeColor : "red",   //"none"
   LINEMouseDownLineStrokeWidth : "none",  //"none"
   LINEMouseEnterDisplay : false,
   LINEMouseEnterLineOpacity : 1,           //"none"
   LINEMouseEnterLineStrokeColor : "red",   //"none"
   LINEMouseEnterLineStrokeWidth : "none",  //"none"
   LINEMouseLeaveDisplay : false,
   LINEMouseLeaveLineOpacity : 1,           //"none"
   LINEMouseLeaveLineStrokeColor : "red",   //"none"
   LINEMouseLeaveLineStrokeWidth : "none",  //"none"
   LINEMouseMoveDisplay : false,
   LINEMouseMoveLineOpacity : 1,           //"none"
   LINEMouseMoveLineStrokeColor : "red",   //"none"
   LINEMouseMoveLineStrokeWidth : "none",  //"none"
   LINEMouseOutDisplay : false,
   LINEMouseOutAnimationTime : 500,
   LINEMouseOutLineOpacity : 1.0,   //"none"
   LINEMouseOutLineStrokeColor : "red",    //"none"
   LINEMouseOutLineStrokeWidth : "none",    //"none"
   LINEMouseUpDisplay : false,
   LINEMouseUpLineOpacity : 1,           //"none"
   LINEMouseUpLineStrokeColor : "red",   //"none"
   LINEMouseUpLineStrokeWidth : "none",  //"none"
   LINEMouseOverDisplay : false,
   LINEMouseOverLineOpacity : 1,           //"none"
   LINEMouseOverLineStrokeColor : "red",   //"none"
   LINEMouseOverLineStrokeWidth : "none",  //"none"
});
(2)Configuration and examples
LINEMouseEventdefault true, [true/false], open/not open mouse event of LINE module
Mouse click
LINEMouseClickDisplaydefault false, [true/false], open/not open mouse click event of LINE module
LINEMouseClickLineOpacitydefault 1.0, “none” means no change, element change opacity after click the element
LINEMouseClickLineStrokeColordefault “red”, “none” means no change, element change stroke color after click the element.
LINEMouseClickLineStrokeWidthdefault “none”, “none” means no change, element change stroke width after click the element.
Mouse down
LINEMouseDownDisplaydefault false, [true/false], open/not open mouse mouse down event of LINE module
LINEMouseDownLineOpacitydefault 1.0, “none” means no change, element change opacity after mouse down the element
LINEMouseDownLineStrokeColordefault “red”, “none” means no change, element change stroke color after mouse down the element.
LINEMouseDownLineStrokeWidthdefault “none”, “none” means no change, element change stroke width after mouse down the element.
Mouse enter
LINEMouseEnterDisplaydefault false, [true/false], open/not open mouse mouse enter event of LINE module
LINEMouseEnterLineOpacitydefault 1.0, “none” means no change, element change opacity after mouse enter the element
LINEMouseEnterLineStrokeColordefault “red”, “none” means no change, element change stroke color after mouse enter the element.
LINEMouseEnterLineStrokeWidthdefault “none”, “none” means no change, element change stroke width after mouse enter the element.
Mouse leave
LINEMouseLeaveDisplaydefault false, [true/false], open/not open mouse mouse leave event of LINE module
LINEMouseLeaveLineOpacitydefault 1.0, “none” means no change, element change opacity after mouse leave the element
LINEMouseLeaveLineStrokeColordefault “red”, “none” means no change, element change stroke color after mouse leave the element.
LINEMouseLeaveLineStrokeWidthdefault “none”, “none” means no change, element change stroke width after mouse leave the element.
Mouse move
LINEMouseMoveDisplaydefault false, [true/false], open/not open mouse mouse move event of LINE module
LINEMouseMoveLineOpacitydefault 1.0, “none” means no change, element change opacity after mouse move the element
LINEMouseMoveLineStrokeColordefault “red”, “none” means no change, element change stroke color after mouse move the element.
LINEMouseMoveLineStrokeWidthdefault “none”, “none” means no change, element change stroke width after mouse move the element.
Mouse out
LINEMouseOutDisplaydefault false, [true/false], open/not open mouse mouse out event of LINE module
LINEMouseOutAnimationTimedefault 500, animation time after mouse out the element
LINEMouseOutLineOpacitydefault 1.0, “none” means no change, element change opacity after mouse out the element
LINEMouseOutLineStrokeColordefault “red”, “none” means no change, element change stroke color after mouse out the element.
LINEMouseOutLineStrokeWidthdefault “none”, “none” means no change, element change stroke width after mouse out the element.
Mouse up
LINEMouseUpDisplaydefault false, [true/false], open/not open mouse mouse up event of LINE module
LINEMouseUpLineOpacitydefault 1.0, “none” means no change, element change opacity after mouse up the element
LINEMouseUpLineStrokeColordefault “red”, “none” means no change, element change stroke color after mouse up the element.
LINEMouseUpLineStrokeWidthdefault “none”, “none” means no change, element change stroke width after mouse up the element.
Mouse over
LINEMouseOverDisplaydefault false, [true/false], open/not open mouse mouse Over event of LINE module
LINEMouseOverLineOpacitydefault 1.0, “none” means no change, element change opacity after mouse Over the element
LINEMouseOverLineStrokeColordefault “red”, “none” means no change, element change stroke color after mouse Over the element.
LINEMouseOverLineStrokeWidthdefault “none”, “none” means no change, element change stroke width after mouse Over the element.
5.4 Customize Tooltips
SNP module
(1)All configuration parameters
Here we show all the configuration parameters in SNP module of Customize Tooltips class.
BioCircos01 = new BioCircos(BioCircosGenome,{
   // Main configuration - Customize Tooltips - SNP module
   SNPMouseOverTooltipsHtml01 : "chr : ",
   SNPMouseOverTooltipsHtml02 : "<br>position : ",
   SNPMouseOverTooltipsHtml03 : "<br>value : ",
   SNPMouseOverTooltipsHtml04 : "<br>des : ",
   SNPMouseOverTooltipsHtml05 : "",
   SNPMouseOverTooltipsPosition : "absolute",
   SNPMouseOverTooltipsBackgroundColor : "white",
   SNPMouseOverTooltipsBorderStyle : "solid",
   SNPMouseOverTooltipsBorderWidth : 0,
   SNPMouseOverTooltipsPadding : "3px",
   SNPMouseOverTooltipsBorderRadius : "3px",
   SNPMouseOverTooltipsOpacity : 0.8,
});
(2)Configuration and examples
Tooltips content
SNPMouseOverTooltipsHtml01default “chr : “
SNPMouseOverTooltipsHtml02default “<br>position : “
SNPMouseOverTooltipsHtml03default “<br>value : “
SNPMouseOverTooltipsHtml04default “<br>des : “
SNPMouseOverTooltipsHtml05default “”
Example: change the tooltips content of SNP module
| Example | Before | After |
|---|---|---|
| Code change | SNPMouseOverTooltipsHtml01 : "chr : ",
SNPMouseOverTooltipsHtml02 : "<br>position : ",
SNPMouseOverTooltipsHtml03 : "<br>value : ",
SNPMouseOverTooltipsHtml04 : "<br>des : ",
|
SNPMouseOverTooltipsHtml01 : "Gene : ",
SNPMouseOverTooltipsHtml02 : "<br>Position(AA) : ",
SNPMouseOverTooltipsHtml03 : "<br>Sample number : ",
SNPMouseOverTooltipsHtml04 : "<br>Mutation information : ",
|
| Image change | 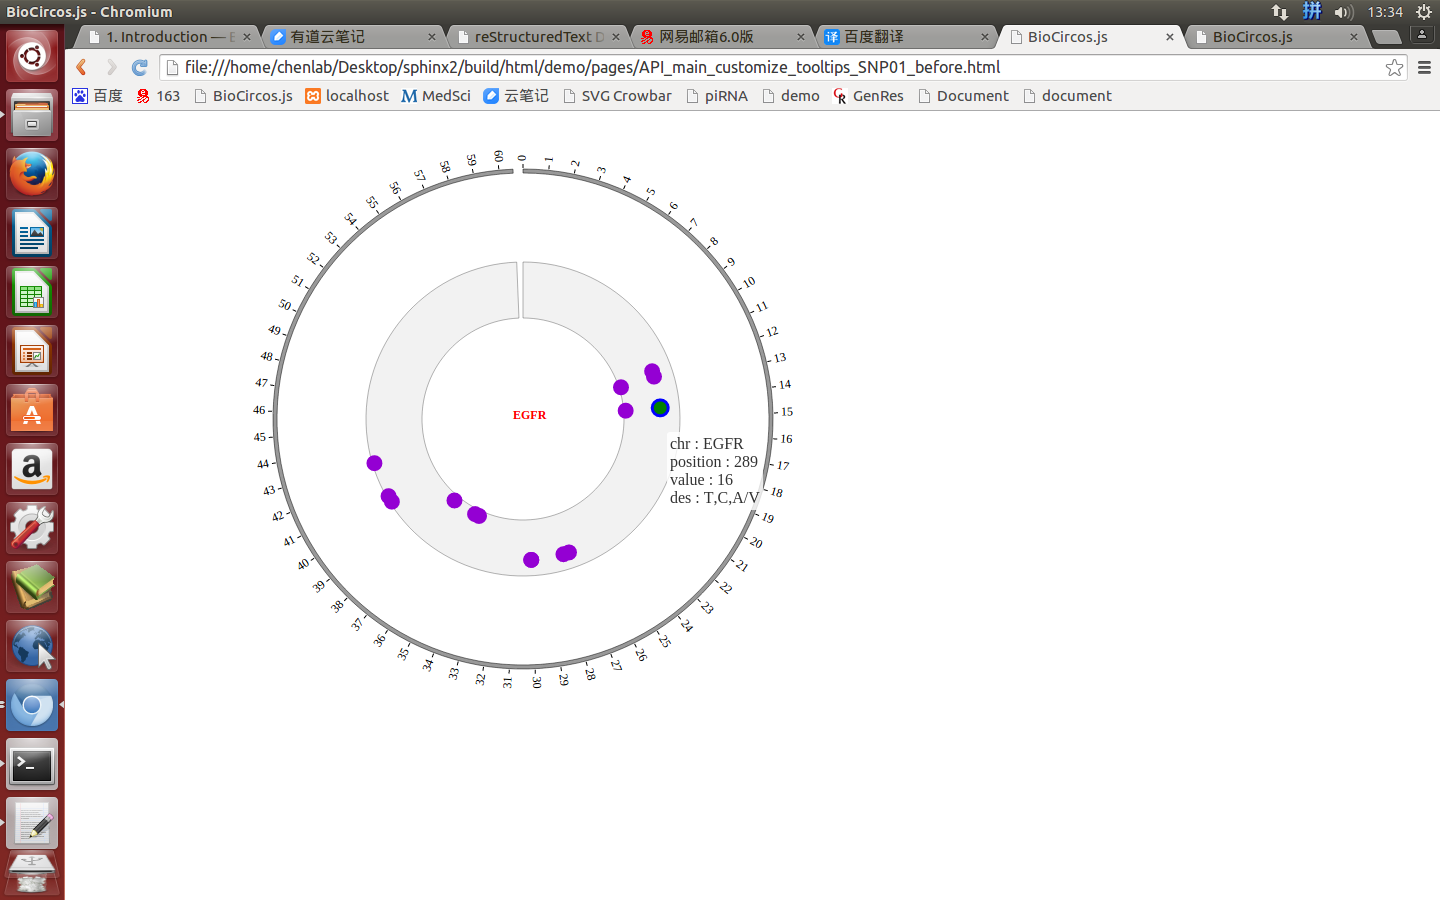
|
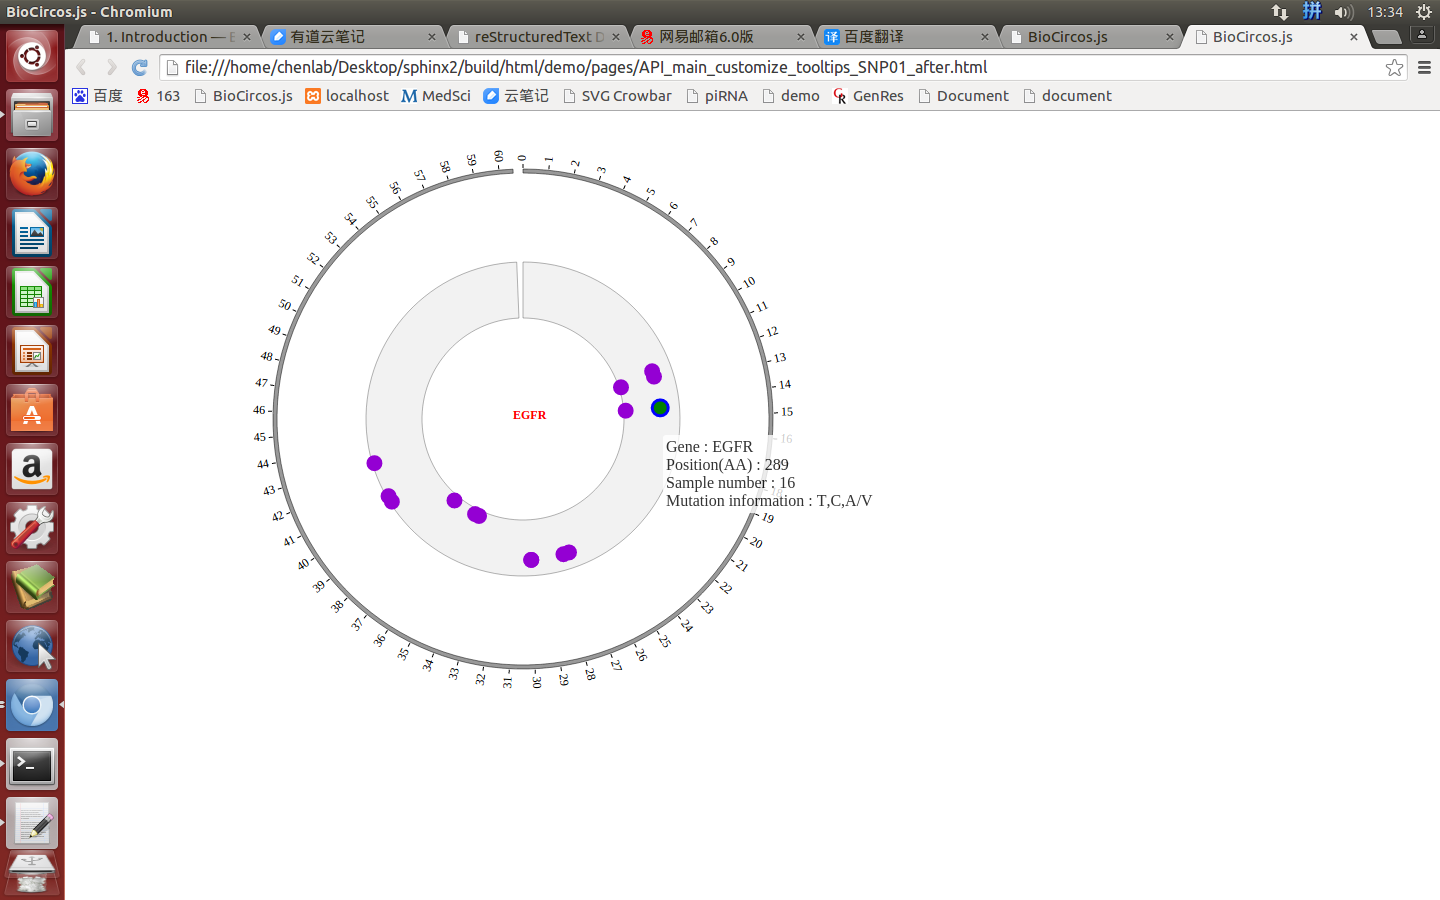
|
Tooltips style
SNPMouseOverTooltipsPositiondefault “absolute”
SNPMouseOverTooltipsBackgroundColordefault “white”
SNPMouseOverTooltipsBorderStyledefault “solid”
SNPMouseOverTooltipsBorderWidthdefault 0
SNPMouseOverTooltipsPaddingdefault “3px”
SNPMouseOverTooltipsBorderRadiusdefault “3px”
SNPMouseOverTooltipsOpacitydefault 0.8
Example: change the tooltips style of SNP module
| Example | Before | After |
|---|---|---|
| Code change | SNPMouseOverTooltipsBorderWidth : 0,
SNPMouseOverTooltipsPadding : "3px",
SNPMouseOverTooltipsBorderRadius : "3px",
SNPMouseOverTooltipsOpacity : 1,
|
SNPMouseOverTooltipsBorderWidth : 1,
SNPMouseOverTooltipsPadding : "5px",
SNPMouseOverTooltipsBorderRadius : "10px",
SNPMouseOverTooltipsOpacity : 0.8,
|
| Image change | 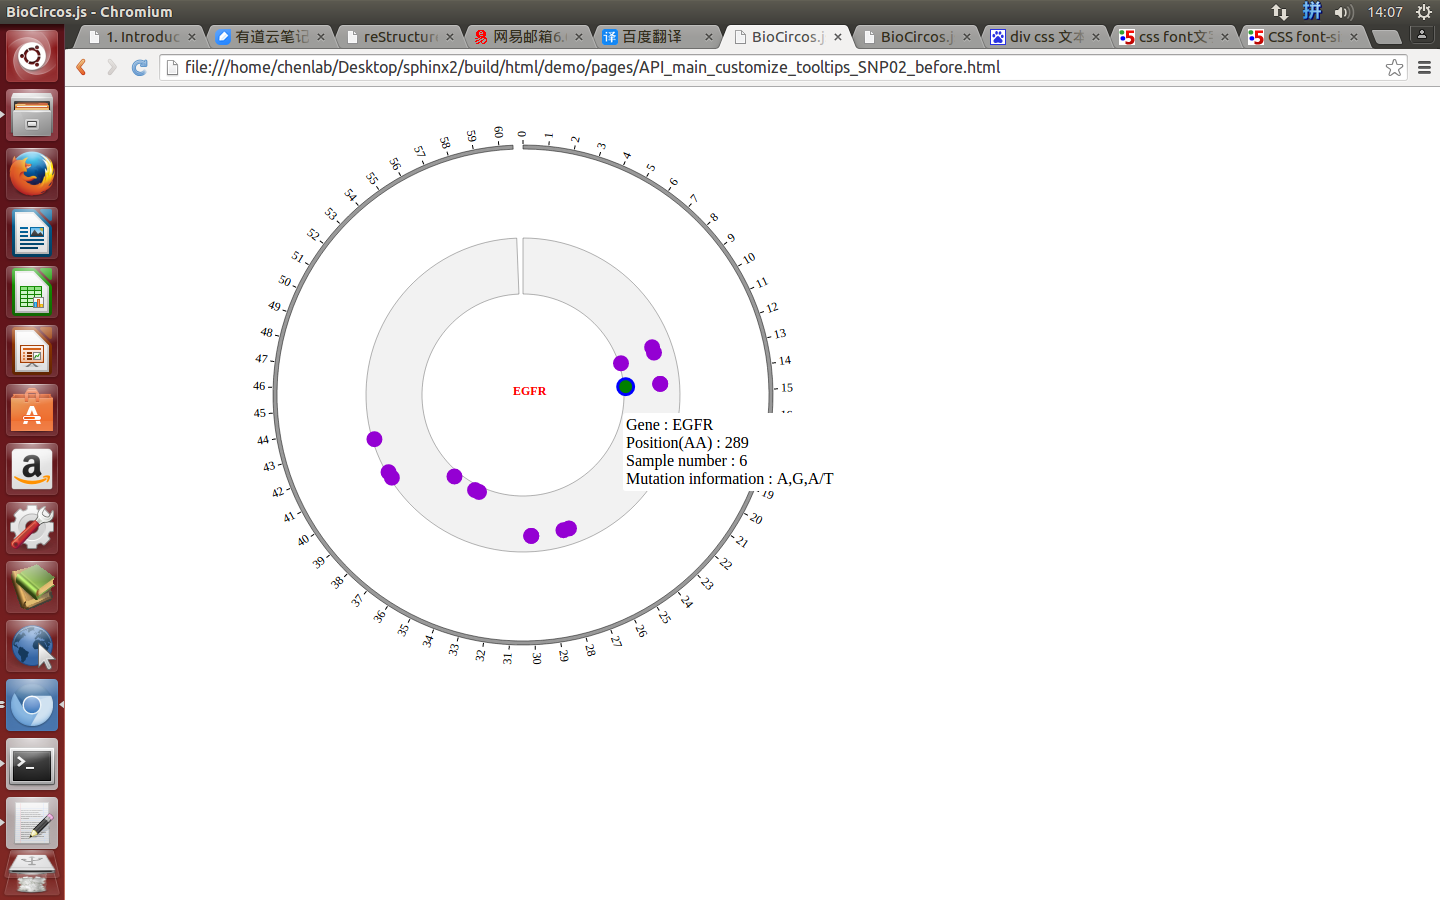
|
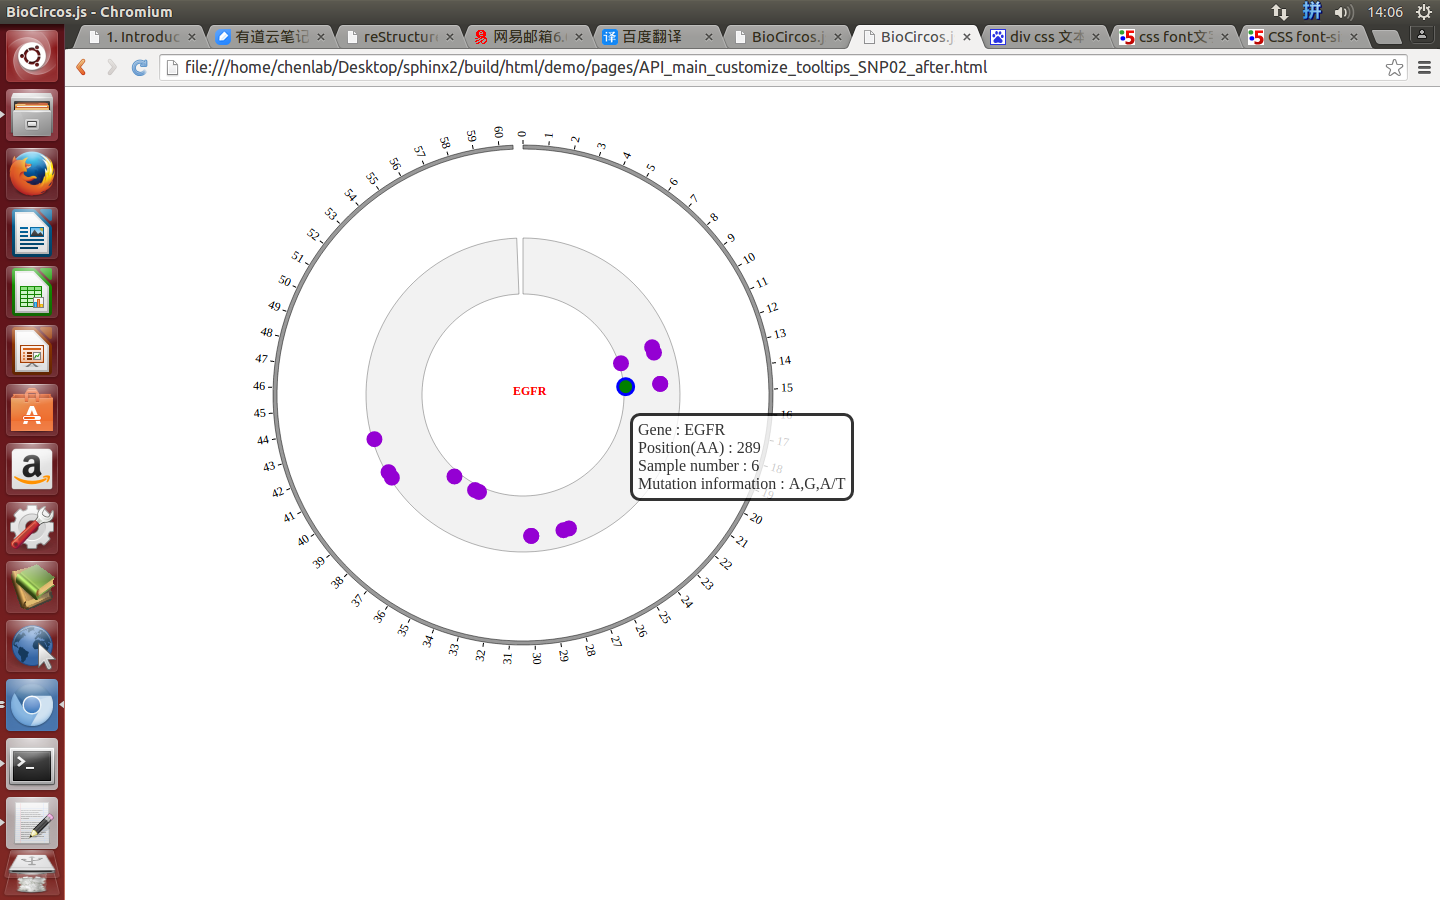
|
SCATTER module
(1)All configuration parameters
Here we show all the configuration parameters in SCATTER module of Customize Tooltips class.
BioCircos01 = new BioCircos(BioCircosGenome,{
   // Main configuration - Customize Tooltips - SCATTER module
   SCATTERMouseOverTooltipsHtml01 : "item : ",
   SCATTERMouseOverTooltipsHtml02 : "<br>start : ",
   SCATTERMouseOverTooltipsHtml03 : "<br>end : ",
   SCATTERMouseOverTooltipsHtml04 : "<br>name : ",
   SCATTERMouseOverTooltipsHtml05 : "<br>des : ",
   SCATTERMouseOverTooltipsHtml06 : "",
   SCATTERMouseOverTooltipsPosition : "absolute",
   SCATTERMouseOverTooltipsBackgroundColor : "white",
   SCATTERMouseOverTooltipsBorderStyle : "solid",
   SCATTERMouseOverTooltipsBorderWidth : 0,
   SCATTERMouseOverTooltipsPadding : "3px",
   SCATTERMouseOverTooltipsBorderRadius : "3px",
   SCATTERMouseOverTooltipsOpacity : 0.8,
});
(2)Configuration and examples
Tooltips content
SCATTERMouseOverTooltipsHtml01default “item : “
SCATTERMouseOverTooltipsHtml02default “<br>start : “
SCATTERMouseOverTooltipsHtml03default “<br>end : “
SCATTERMouseOverTooltipsHtml04default “<br>name : “
SCATTERMouseOverTooltipsHtml05default “<br>des : “
SCATTERMouseOverTooltipsHtml06default “”
Example: change the tooltips content of SCATTER module
| Example | Before | After |
|---|---|---|
| Code change | SCATTERMouseOverTooltipsHtml01 : "item : ",
SCATTERMouseOverTooltipsHtml02 : "<br>start : ",
SCATTERMouseOverTooltipsHtml03 : "<br>end : ",
SCATTERMouseOverTooltipsHtml04 : "<br>name : ",
SCATTERMouseOverTooltipsHtml05 : "<br>des : ",
|
SCATTERMouseOverTooltipsHtml01 : "chr : ",
SCATTERMouseOverTooltipsHtml02 : "<br>start : ",
SCATTERMouseOverTooltipsHtml03 : "<br>end : ",
SCATTERMouseOverTooltipsHtml04 : "<br>name : ",
SCATTERMouseOverTooltipsHtml05 : "<br>cancer type : ",
|
| Image change | 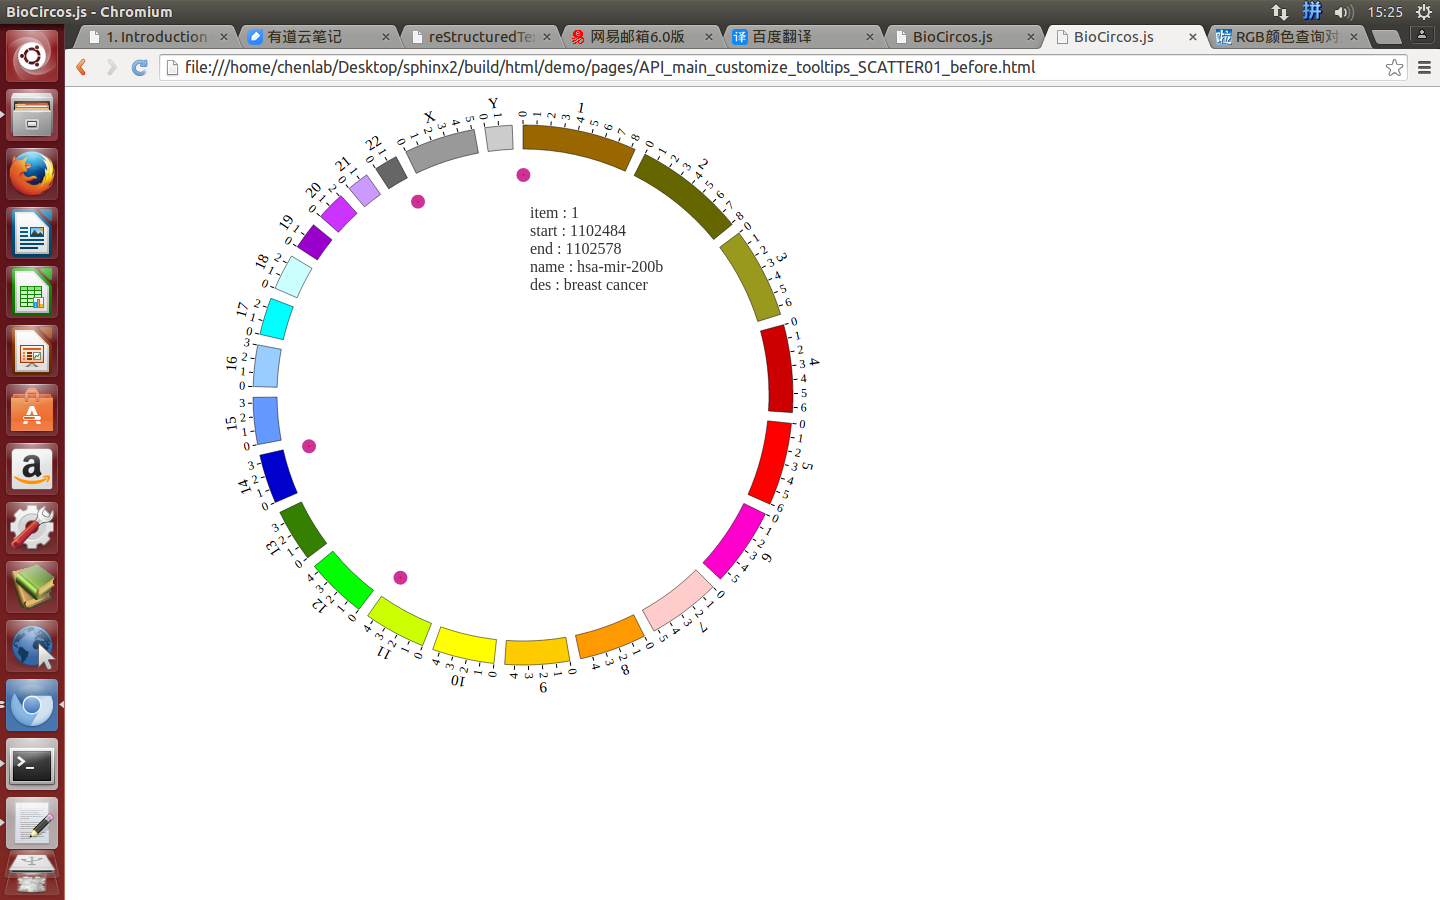
|
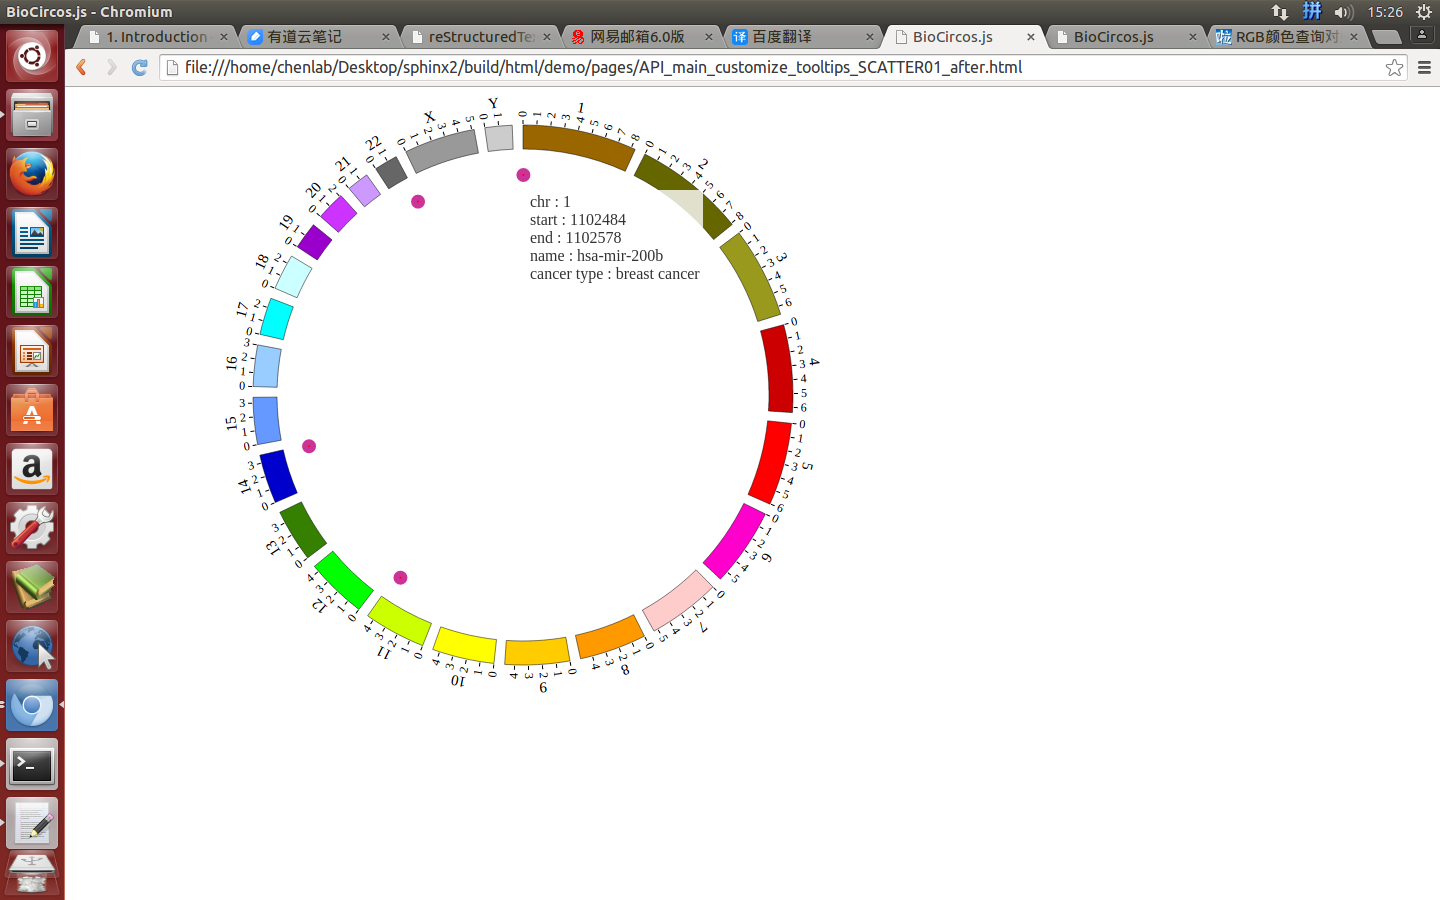
|
Tooltips style
SCATTERMouseOverTooltipsPositiondefault “absolute”
SCATTERMouseOverTooltipsBackgroundColordefault “white”
SCATTERMouseOverTooltipsBorderStyledefault “solid”
SCATTERMouseOverTooltipsBorderWidthdefault 0
SCATTERMouseOverTooltipsPaddingdefault “3px”
SCATTERMouseOverTooltipsBorderRadiusdefault “3px”
SCATTERMouseOverTooltipsOpacitydefault 0.8
Example: change the tooltips style of SCATTER module
| Example | Before | After |
|---|---|---|
| Code change | SCATTERMouseOverTooltipsBackgroundColor : "white",
SCATTERMouseOverTooltipsBorderWidth : 0,
SCATTERMouseOverTooltipsBorderRadius : "3px",
SCATTERMouseOverTooltipsOpacity : 0.8,
|
SCATTERMouseOverTooltipsBackgroundColor : "#DCDCDC",
SCATTERMouseOverTooltipsBorderWidth : 1,
SCATTERMouseOverTooltipsBorderRadius : "5px",
SCATTERMouseOverTooltipsOpacity : 0.7,
|
| Image change | 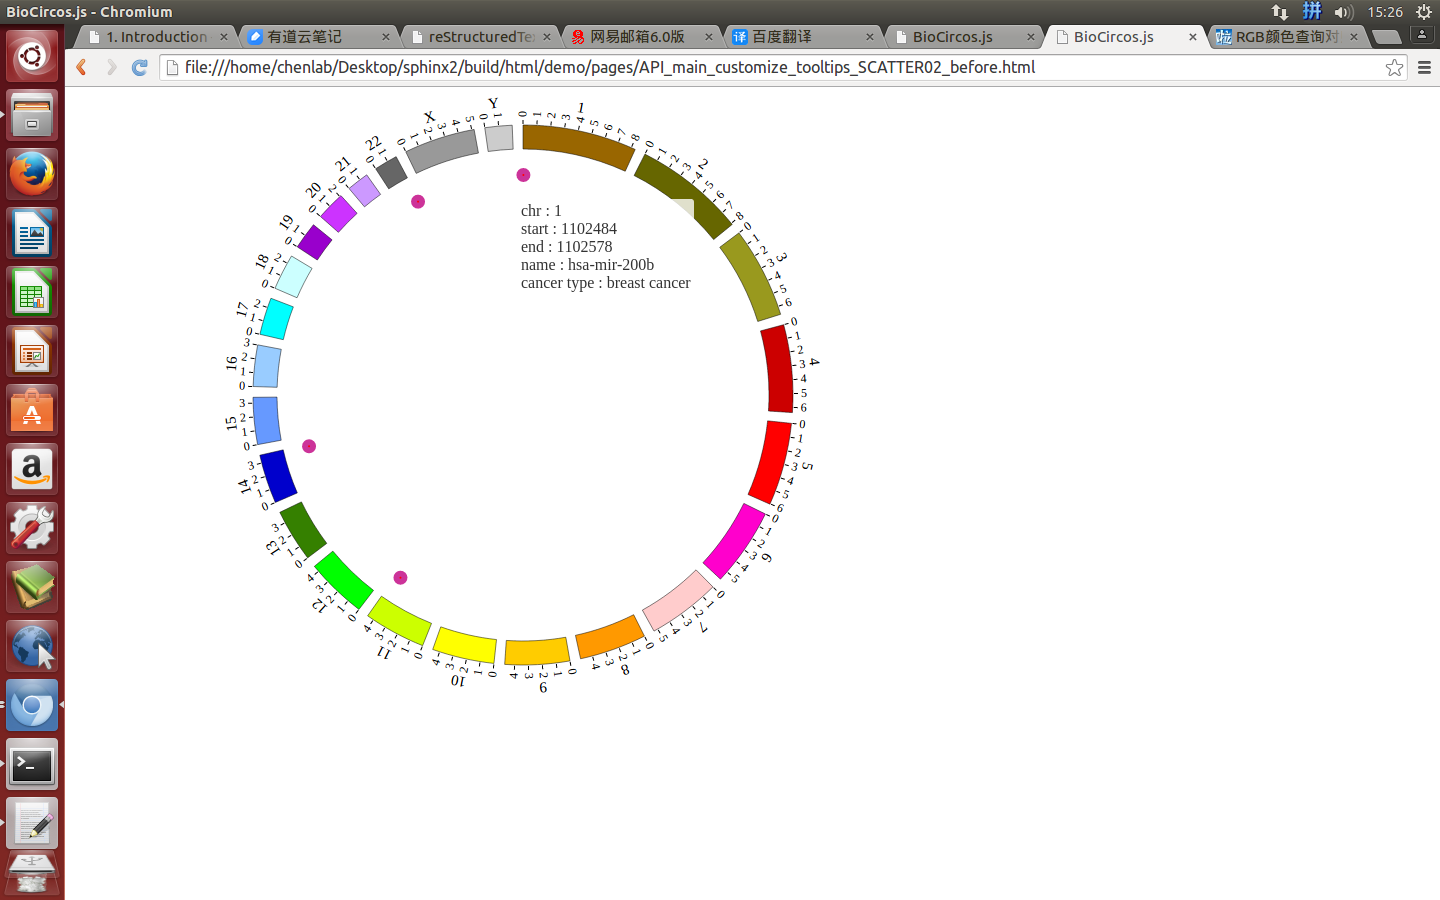
|
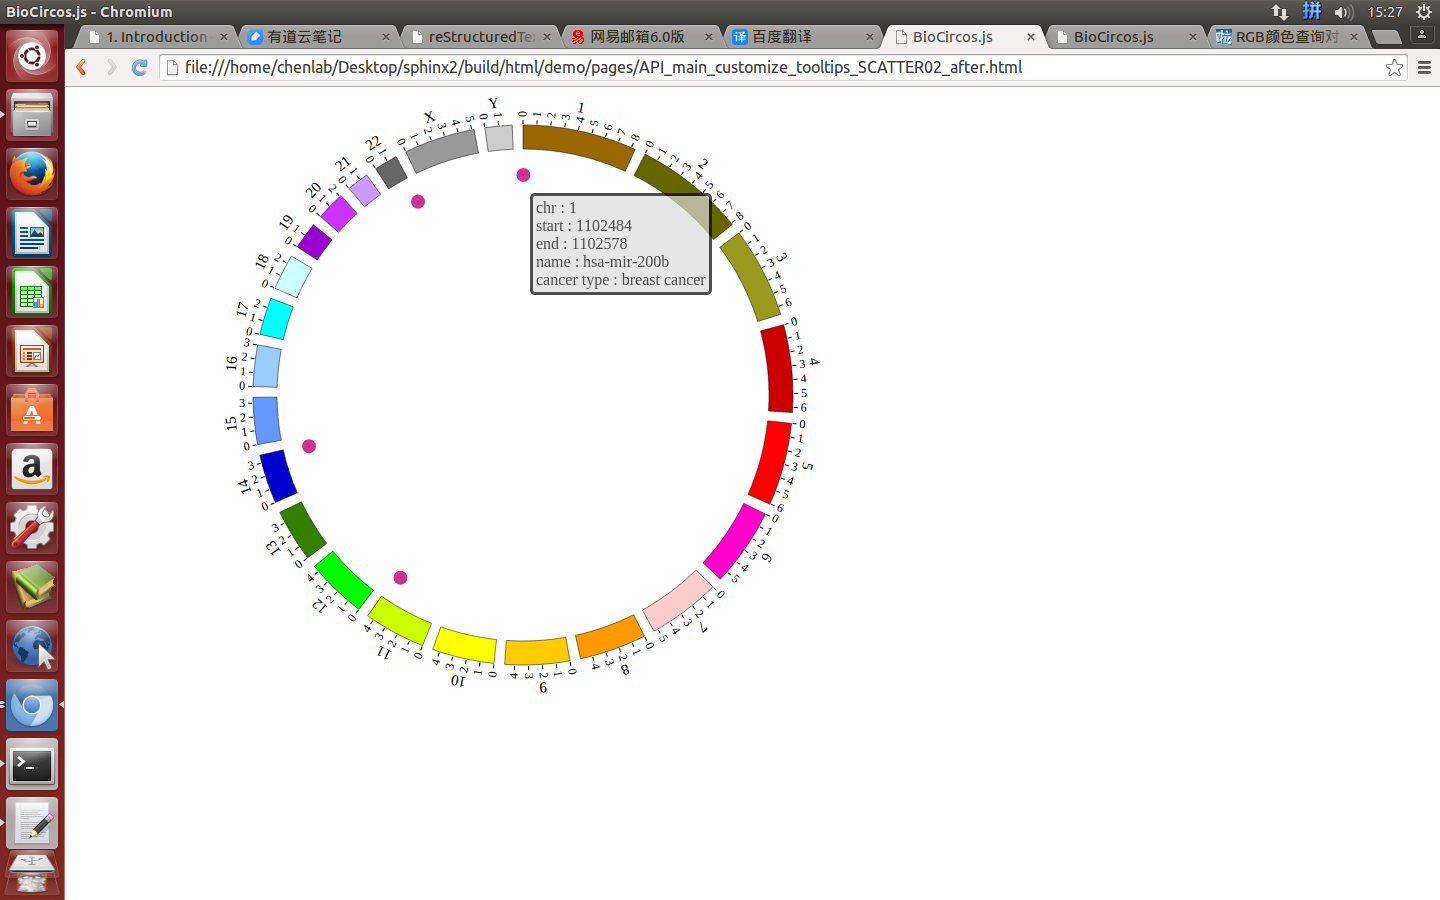
|
LINK module
(1)All configuration parameters
Here we show all the configuration parameters in LINK module of Customize Tooltips class.
BioCircos01 = new BioCircos(BioCircosGenome,{
   // Main configuration - Customize Tooltips - LINK module
   LINKMouseOverTooltipsHtml01 : "Link : ",
   LINKMouseOverTooltipsHtml02 : "",
   LINKMouseOverTooltipsPosition : "absolute",
   LINKMouseOverTooltipsBackgroundColor : "white",
   LINKMouseOverTooltipsBorderStyle : "solid",
   LINKMouseOverTooltipsBorderWidth : 0,
   LINKMouseOverTooltipsPadding : "3px",
   LINKMouseOverTooltipsBorderRadius : "3px",
   LINKMouseOverTooltipsOpacity : 0.8,
});
(2)Configuration and examples
Tooltips content
LINKMouseOverTooltipsHtml01default “Link : “
LINKMouseOverTooltipsHtml02default “”
Tooltips style
LINKMouseOverTooltipsPositiondefault “absolute”
LINKMouseOverTooltipsBackgroundColordefault “white”
LINKMouseOverTooltipsBorderStyledefault “solid”
LINKMouseOverTooltipsBorderWidthdefault 0
LINKMouseOverTooltipsPaddingdefault “3px”
LINKMouseOverTooltipsBorderRadiusdefault “3px”
LINKMouseOverTooltipsOpacitydefault 0.8
CNV module
(1)All configuration parameters
Here we show all the configuration parameters in CNV module of Customize Tooltips class.
BioCircos01 = new BioCircos(BioCircosGenome,{
   // Main configuration - Customize Tooltips - CNV module
   CNVMouseOverTooltipsHtml01 : "chr : ",
   CNVMouseOverTooltipsHtml02 : "<br>start : ",
   CNVMouseOverTooltipsHtml03 : "<br>end : ",
   CNVMouseOverTooltipsHtml04 : "<br>value : ",
   CNVMouseOverTooltipsHtml05 : "",
   CNVMouseOverTooltipsPosition : "absolute",
   CNVMouseOverTooltipsBackgroundColor : "white",
   CNVMouseOverTooltipsBorderStyle : "solid",
   CNVMouseOverTooltipsBorderWidth : 0,
   CNVMouseOverTooltipsPadding : "3px",
   CNVMouseOverTooltipsBorderRadius : "3px",
   CNVMouseOverTooltipsOpacity : 0.8,
});
(2)Configuration and examples
Tooltips content
CNVMouseOverTooltipsHtml01default “chr : “
CNVMouseOverTooltipsHtml02default “<br>start : “
CNVMouseOverTooltipsHtml03default “<br>end : “
CNVMouseOverTooltipsHtml04default “<br>value : “
CNVMouseOverTooltipsHtml05default “”
Tooltips style
CNVMouseOverTooltipsPositiondefault “absolute”
CNVMouseOverTooltipsBackgroundColordefault “white”
CNVMouseOverTooltipsBorderStyledefault “solid”
CNVMouseOverTooltipsBorderWidthdefault 0
CNVMouseOverTooltipsPaddingdefault “3px”
CNVMouseOverTooltipsBorderRadiusdefault “3px”
CNVMouseOverTooltipsOpacitydefault 0.8
ARC module
(1)All configuration parameters
Here we show all the configuration parameters in ARC module of Customize Tooltips class.
BioCircos01 = new BioCircos(BioCircosGenome,{
   // Main configuration - Customize Tooltips - ARC module
   ARCMouseOverTooltipsHtml01 : "item : ",
   ARCMouseOverTooltipsHtml02 : "<br>start : ",
   ARCMouseOverTooltipsHtml03 : "<br>end : ",
   ARCMouseOverTooltipsHtml04 : "<br>des : ",
   ARCMouseOverTooltipsHtml05 : "",
   ARCMouseOverTooltipsPosition : "absolute",
   ARCMouseOverTooltipsBackgroundColor : "white",
   ARCMouseOverTooltipsBorderStyle : "solid",
   ARCMouseOverTooltipsBorderWidth : 0,
   ARCMouseOverTooltipsPadding : "3px",
   ARCMouseOverTooltipsBorderRadius : "3px",
   ARCMouseOverTooltipsOpacity : 0.8,
});
(2)Configuration and examples
Tooltips content
ARCMouseOverTooltipsHtml01default “item : “
ARCMouseOverTooltipsHtml02default “<br>start : “
ARCMouseOverTooltipsHtml03default “<br>end : “
ARCMouseOverTooltipsHtml04default “<br>des : “
ARCMouseOverTooltipsHtml05default “”
Tooltips style
ARCMouseOverTooltipsPositiondefault “absolute”
ARCMouseOverTooltipsBackgroundColordefault “white”
ARCMouseOverTooltipsBorderStyledefault “solid”
ARCMouseOverTooltipsBorderWidthdefault 0
ARCMouseOverTooltipsPaddingdefault “3px”
ARCMouseOverTooltipsBorderRadiusdefault “3px”
ARCMouseOverTooltipsOpacitydefault 0.8
HEATMAP module
(1)All configuration parameters
Here we show all the configuration parameters in HEATMAP module of Customize Tooltips class.
BioCircos01 = new BioCircos(BioCircosGenome,{
   // Main configuration - Customize Tooltips - HEATMAP module
   HEATMAPMouseOverTooltipsHtml01 : "chr : ",
   HEATMAPMouseOverTooltipsHtml02 : "<br>position: ",
   HEATMAPMouseOverTooltipsHtml03 : "-",
   HEATMAPMouseOverTooltipsHtml04 : "<br>name : ",
   HEATMAPMouseOverTooltipsHtml05 : "<br>value : ",
   HEATMAPMouseOverTooltipsHtml06 : "",
   HEATMAPMouseOverTooltipsPosition : "absolute",
   HEATMAPMouseOverTooltipsBackgroundColor : "white",
   HEATMAPMouseOverTooltipsBorderStyle : "solid",
   HEATMAPMouseOverTooltipsBorderWidth : 0,
   HEATMAPMouseOverTooltipsPadding : "3px",
   HEATMAPMouseOverTooltipsBorderRadius : "3px",
   HEATMAPMouseOverTooltipsOpacity : 0.8,
});
(2)Configuration and examples
Tooltips content
HEATMAPMouseOverTooltipsHtml01default “chr : “
HEATMAPMouseOverTooltipsHtml02default “<br>position: “
HEATMAPMouseOverTooltipsHtml03default “-“
HEATMAPMouseOverTooltipsHtml04default “<br>name : “
HEATMAPMouseOverTooltipsHtml05default “<br>value : “
HEATMAPMouseOverTooltipsHtml06default “”
Tooltips style
HEATMAPMouseOverTooltipsPositiondefault “absolute”
HEATMAPMouseOverTooltipsBackgroundColordefault “white”
HEATMAPMouseOverTooltipsBorderStyledefault “solid”
HEATMAPMouseOverTooltipsBorderWidthdefault 0
HEATMAPMouseOverTooltipsPaddingdefault “3px”
HEATMAPMouseOverTooltipsBorderRadiusdefault “3px”
HEATMAPMouseOverTooltipsOpacitydefault 0.8
HISTOGRAM module
(1)All configuration parameters
Here we show all the configuration parameters in HISTOGRAM module of Customize Tooltips class.
BioCircos01 = new BioCircos(BioCircosGenome,{
   // Main configuration - Customize Tooltips - HISTOGRAM module
   HISTOGRAMMouseOverTooltipsHtml01 : "chr :",
   HISTOGRAMMouseOverTooltipsHtml02 : "<br>position: ",
   HISTOGRAMMouseOverTooltipsHtml03 : "-",
   HISTOGRAMMouseOverTooltipsHtml04 : "<br>name : ",
   HISTOGRAMMouseOverTooltipsHtml05 : "<br>value : ",
   HISTOGRAMMouseOverTooltipsHtml06 : "",
   HISTOGRAMMouseOverTooltipsPosition : "absolute",
   HISTOGRAMMouseOverTooltipsBackgroundColor : "white",
   HISTOGRAMMouseOverTooltipsBorderStyle : "solid",
   HISTOGRAMMouseOverTooltipsBorderWidth : 0,
   HISTOGRAMMouseOverTooltipsPadding : "3px",
   HISTOGRAMMouseOverTooltipsBorderRadius : "3px",
   HISTOGRAMMouseOverTooltipsOpacity : 0.8,
});
(2)Configuration and examples
Tooltips content
HISTOGRAMMouseOverTooltipsHtml01default “chr :”
HISTOGRAMMouseOverTooltipsHtml02default “<br>position: “
HISTOGRAMMouseOverTooltipsHtml03default “-“
HISTOGRAMMouseOverTooltipsHtml04default “<br>name : “
HISTOGRAMMouseOverTooltipsHtml05default “<br>value : “
HISTOGRAMMouseOverTooltipsHtml06default “”
Tooltips style
HISTOGRAMMouseOverTooltipsPositiondefault “absolute”
HISTOGRAMMouseOverTooltipsBackgroundColordefault “white”
HISTOGRAMMouseOverTooltipsBorderStyledefault “solid”
HISTOGRAMMouseOverTooltipsBorderWidthdefault 0
HISTOGRAMMouseOverTooltipsPaddingdefault “3px”
HISTOGRAMMouseOverTooltipsBorderRadiusdefault “3px”
HISTOGRAMMouseOverTooltipsOpacitydefault 0.8
LINE module
(1)All configuration parameters
Here we show all the configuration parameters in LINE module of Customize Tooltips class.
BioCircos01 = new BioCircos(BioCircosGenome,{
   // Main configuration - Customize Tooltips - LINE module
   LINEMouseOverTooltipsHtml01 : "Line",
   LINEMouseOverTooltipsPosition : "absolute",
   LINEMouseOverTooltipsBackgroundColor : "white",
   LINEMouseOverTooltipsBorderStyle : "solid",
   LINEMouseOverTooltipsBorderWidth : 0,
   LINEMouseOverTooltipsPadding : "3px",
   LINEMouseOverTooltipsBorderRadius : "3px",
   LINEMouseOverTooltipsOpacity : 0.8,
});
(2)Configuration and examples
Tooltips style
LINEMouseOverTooltipsPositiondefault “absolute”
LINEMouseOverTooltipsBackgroundColordefault “white”
LINEMouseOverTooltipsBorderStyledefault “solid”
LINEMouseOverTooltipsBorderWidthdefault 0
LINEMouseOverTooltipsPaddingdefault “3px”
LINEMouseOverTooltipsBorderRadiusdefault “3px”
LINEMouseOverTooltipsOpacitydefault 0.8
Advanced tooltips
Tooltips is a html element : <div class="BioCircos(Module)Tooltip">. So web developers can use CSS to configure tooltips.
(1)CSS API for advanced users
<style>
.BioCircos(Module)Tooltip {   //eg: BioCircosSNPTooltip
    background-color: #000;
    color: white;
    font-size: 18px;
    font-weight: bold;
    font-family: Arial;
    ......
}
</style>
(2)Example: CSS API for SNP module
| Example | Before | After |
|---|---|---|
| Code change | <style>
.BioCircosSNPTooltip {
border-color: #000;
color: white;
font-size: 18px;
font-weight: 100;
font-family: Arial;
}
</style>
|
<style>
.BioCircosSNPTooltip {
    border-color: #000;
    color: red;
    font-size: 18px;
    font-weight: bold;
    font-family: Arial;
}
</style>
|
| Image change | 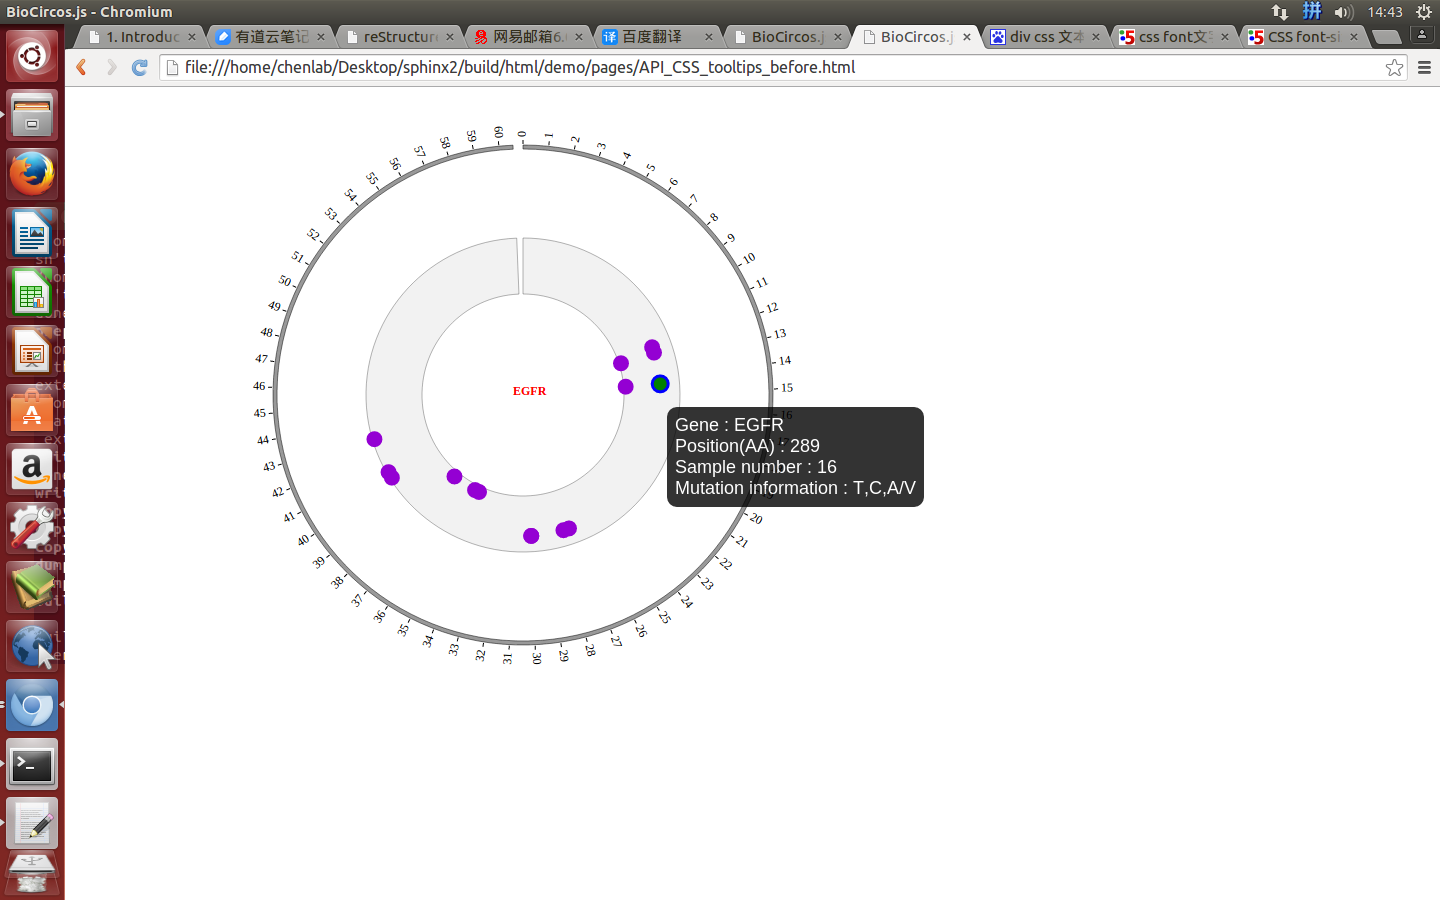
|
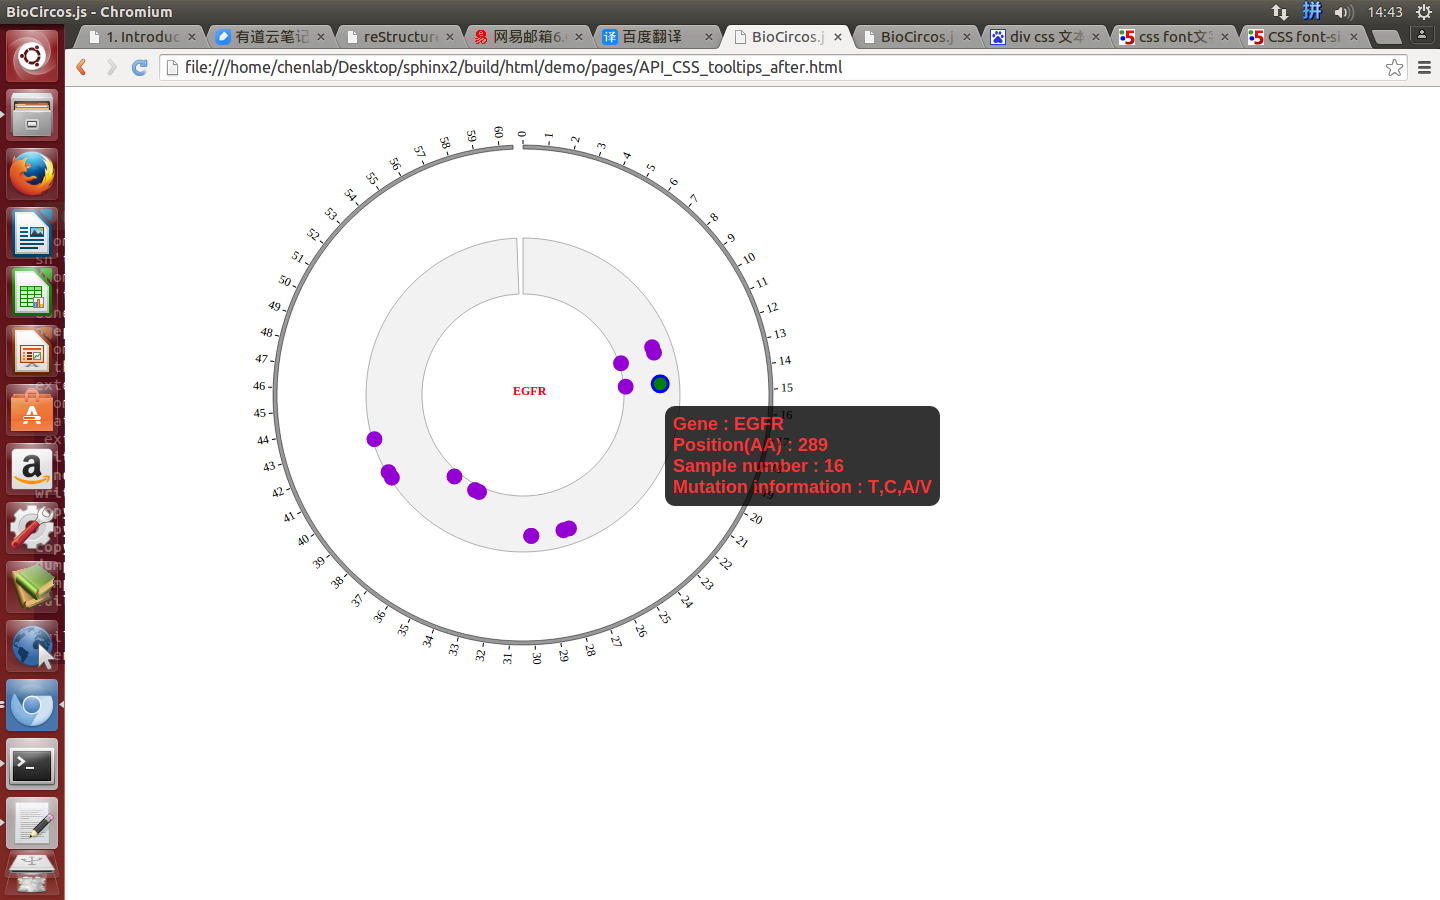
|
6. API: Data configuration
6.1 SNP module
var SNP01 = [ "SNP01" , {
  maxRadius: 205,
  minRadius: 153,
  SNPFillColor: "#9400D3",
  PointType: "circle",
  circleSize: 2,
  rectWidth: 2,
  rectHeight: 2,
  SNPAnimationDisplay: false,
  SNPAnimationTime: 2000,
  SNPAnimationDelay: 20,
  SNPAnimationType: "bounce",  //linear,circle,elastic,bounce
} , [
  {chr: "10", pos: "100315722", value: "20.2218", des: "rs603424", color: "rgb(153,102,0)"},
  {chr: "10", pos: "101219450", value: "19", des: "rs11190870", color: "rgb(153,102,0)"},
  {chr: "10", pos: "103086421", value: "25.1549", des: "rs11191548", color: "rgb(153,102,0)"},
  {chr: "10", pos: "112998590", value: "74.0969", des: "rs7903146", color: "rgb(153,102,0)"},
  {chr: "10", pos: "121577821", value: "169.699", des: "rs2981579", color: "rgb(153,102,0)"},
   ......
  {chr: "X", pos: "5266661", value: "24.699", des: "rs6638512", color: "rgb(153,153,153)"},
  {chr: "X", pos: "67343176", value: "90.699", des: "rs2497938", color: "rgb(153,153,153)"},
  {chr: "X", pos: "69578860", value: "18.1549", des: "rs11796357", color: "rgb(153,153,153)"},
  {chr: "X", pos: "79241621", value: "32.699", des: "rs5912838", color: "rgb(153,153,153)"},
]];
Part 1 : Configuration
maxRadiusdefault 205, max radius to show SNPs with max vlaue
minRadiusdefault 173, min radius to show SNPs with min vlaue
SNPFillColordefault “#9400D3”, SNP color
PointTypedefault “circle”, [circle/rect], circle/rect point
circleSizedefault 2, size of circle
rectWidthdefault 2, width of rect
rectHeightdefault 2, height of rect
Example: change data configuration of SNP module
| Example | Before | After |
|---|---|---|
| Code change | minRadius: 153,
circleSize: 2,
|
minRadius: 103,
circleSize: 3,
|
| Image change | 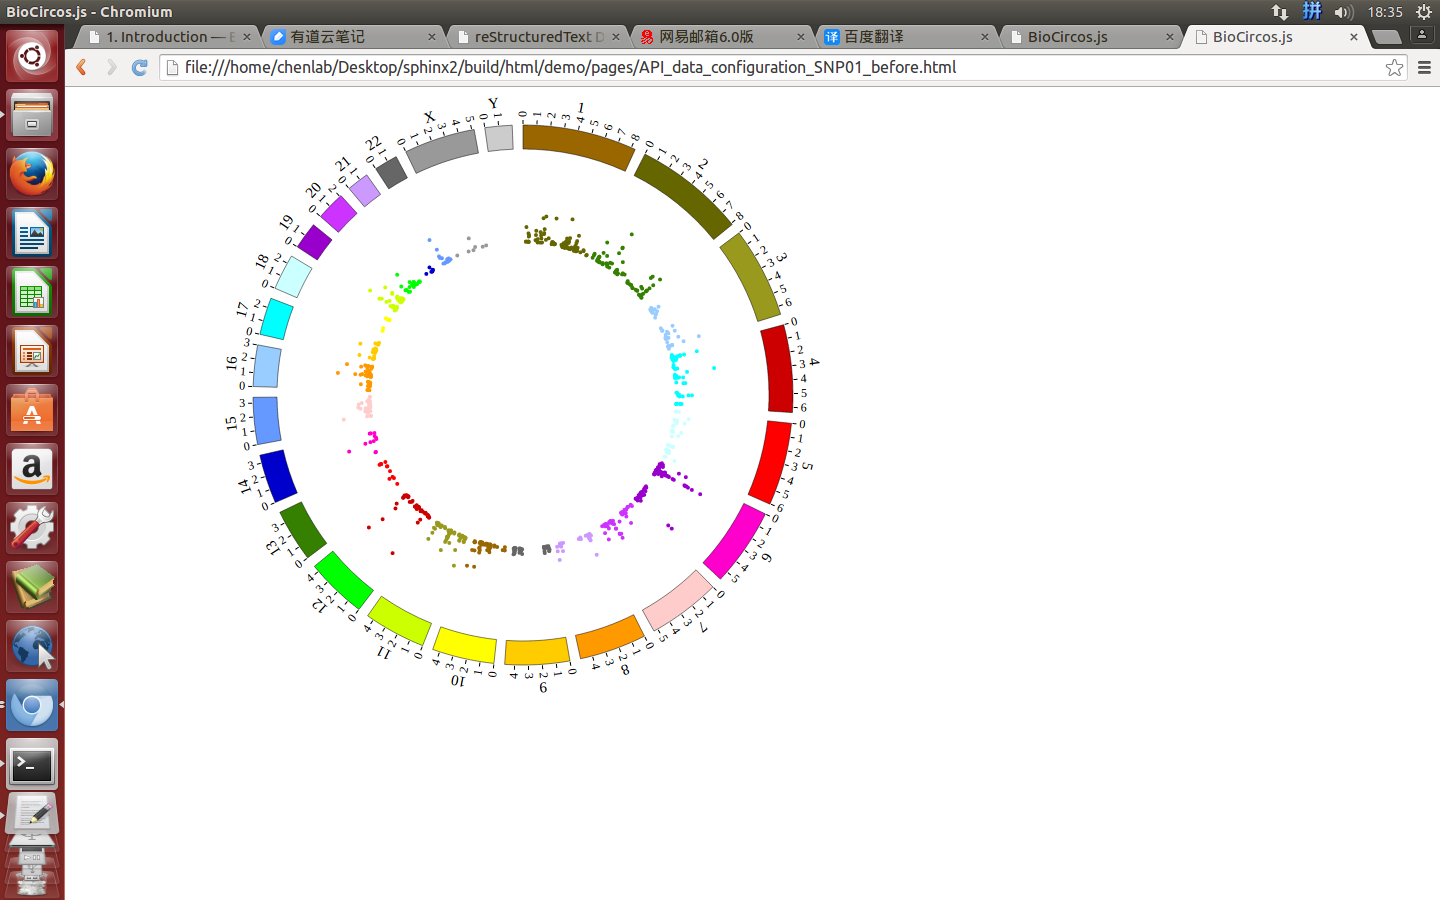
|
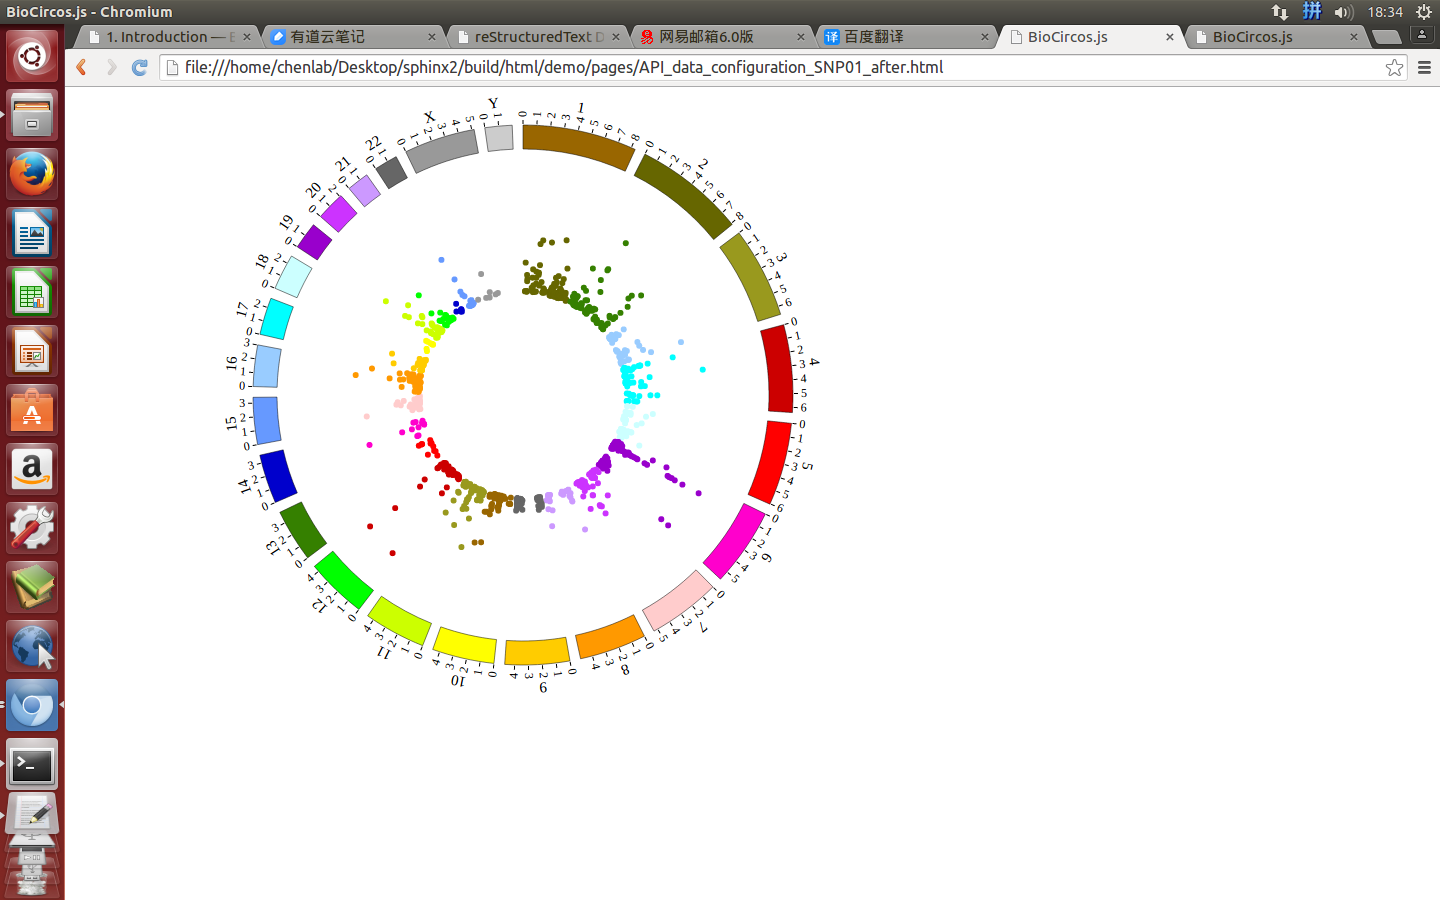
|
SNPAnimationDisplaydefault “false”, [true/false], open/not open animation event of SNP module
SNPAnimationTimedefault 2000, specifies the animation time in milliseconds.
SNPAnimationDelaydefault 20, specifies the animation delay in milliseconds.
SNPAnimationTypedefault “bounce”, [linear/circle/elastic/bounce], “linear” means ordinary linear change; “circle” means change to the final state of the animation; “elastic” means change to the final state with a bounce; “bounce” means bounce a few times in the final state.
Example: SNP Animation
| Example | Before | After |
|---|---|---|
| Code change | SNPFillColor: "#9400D3",
SNPAnimationDisplay: true,
SNPAnimationTime: 1000,
SNPAnimationDelay: 0,
SNPAnimationType: "circle",
|
SNPFillColor: "red",
SNPAnimationDisplay: true,
SNPAnimationTime: 2000,
SNPAnimationDelay: 20,
SNPAnimationType: "bounce",
|
| Image change | 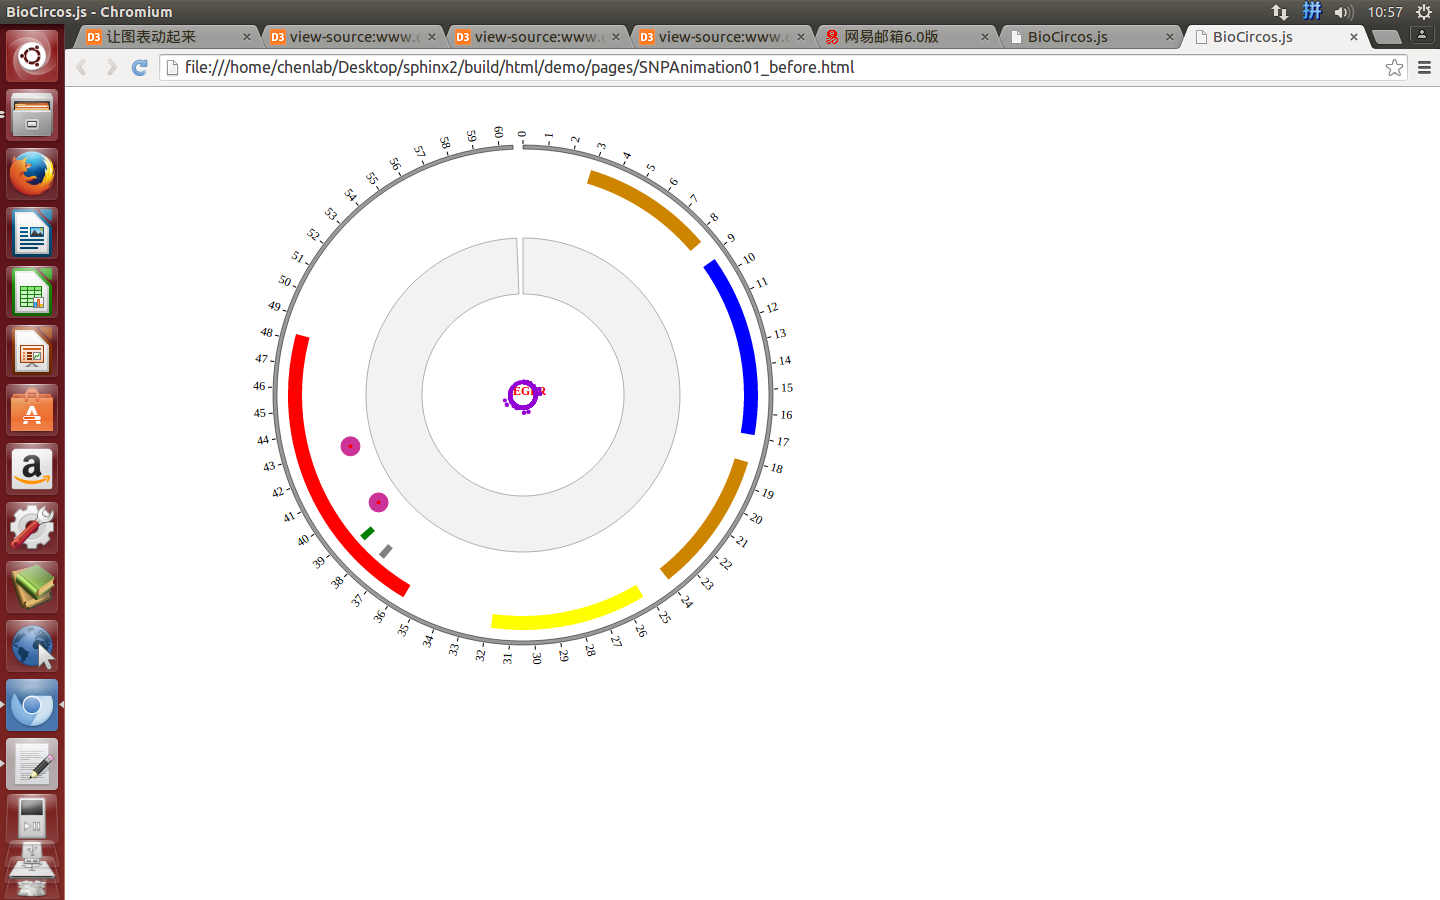
|
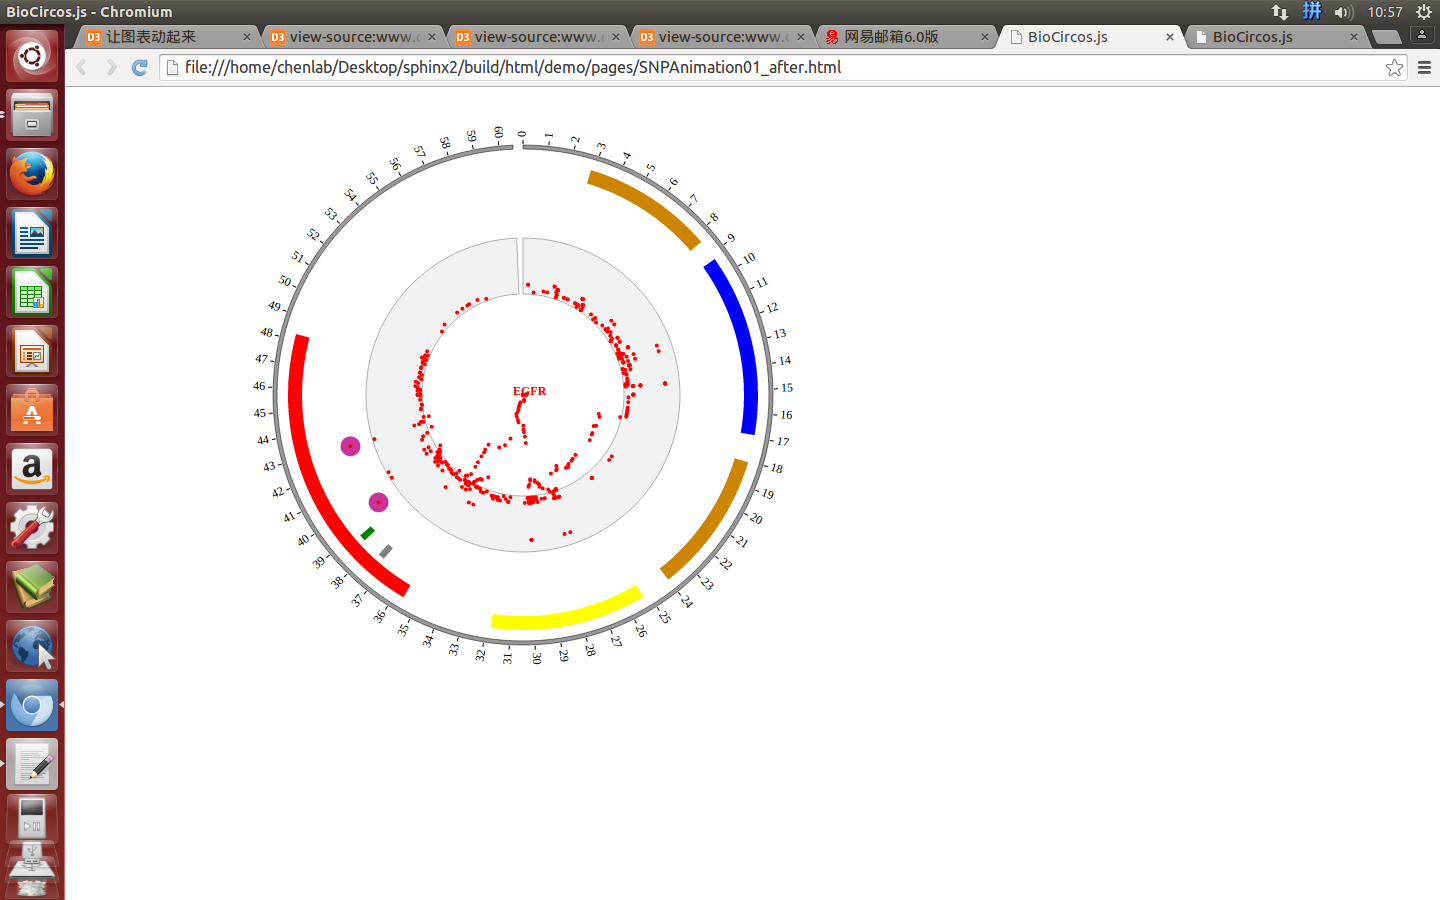
|
Part 2 : Data
- The 1 column(
chr) is the name of the chromosome. - The 2 column(
pos) is the position of the SNP. - The 3 column(
value) is the value(density, P-value, etc.) of the SNP. - The 4 column(
des) is the description of the SNP. - The 5 column(
color) is the color of this SNP point.
6.2 SCATTER module
var SCATTER01 = [ "SCATTER01" , {
  SCATTERRadius: 220,
  innerCircleSize: 1,
  outerCircleSize: 7,
  innerCircleColor: "red",
  outerCircleColor: "#CC3399",
  innerPointType: "circle", //circle,rect
  outerPointType: "circle", //circle,rect
  innerrectWidth: 2,
  innerrectHeight: 2,
  outerrectWidth: 10,
  outerrectHeight: 10,
  outerCircleOpacity: 1,
  random_data: 0,
  SCATTERAnimationDisplay: false,
  SCATTERAnimationTime: 2000,
  SCATTERAnimationDelay: 20,
  SCATTERAnimationType: "bounce",  //linear,circle,elastic,bounce
} , [
  {chr: "1", start: "1102484", end: "1102578", name: "hsa-mir-200b", des: "breast cancer"},
  {chr: "11", start: "122017230", end: "122017301", name: "hsa-let-7a-2", des: "ovarian cancer"},
  {chr: "22", start: "46508629", end: "46508702", name: "hsa-let-7a-3", des: "leukemia cancer"},
  {chr: "14", start: "101349316", end: "101349412", name: "hsa-mir-127", des: "breast cancer"},
]];
Part 1 : Configuration
SCATTERRadiusdefault 220, radius of scatter circle
innerCircleSizedefault 1, inner circle size
outerCircleSizedefault 7, outer circle size
innerCircleColordefault “red”, inner circle color
outerCircleColordefault “#CC3399”, outer circle color
innerPointTypedefault “circle”, [circle/rect], circle/rect point
outerPointTypedefault “circle”, [circle/rect], circle/rect point
innerrectWidthdefault 2, width of inner rect
innerrectHeightdefault 2, height of inner rect
outerrectWidthdefault 2, width of outer rect
outerrectHeightdefault 2, height of outer rect
outerCircleOpacitydefault 1, opacity of outer circle
random_datadefault 0, scatter position fluctuation
Example: change data configuration of SCATTER module
| Example | Before | After |
|---|---|---|
| Code change | SCATTERRadius: 220,
innerCircleSize: 1,
outerCircleSize: 7,
outerCircleColor: "#CC3399",
outerCircleOpacity: 1,
|
SCATTERRadius: 190,
innerCircleSize: 2,
outerCircleSize: 9,
outerCircleColor: "green",
outerCircleOpacity: 0.5,
|
| Image change | 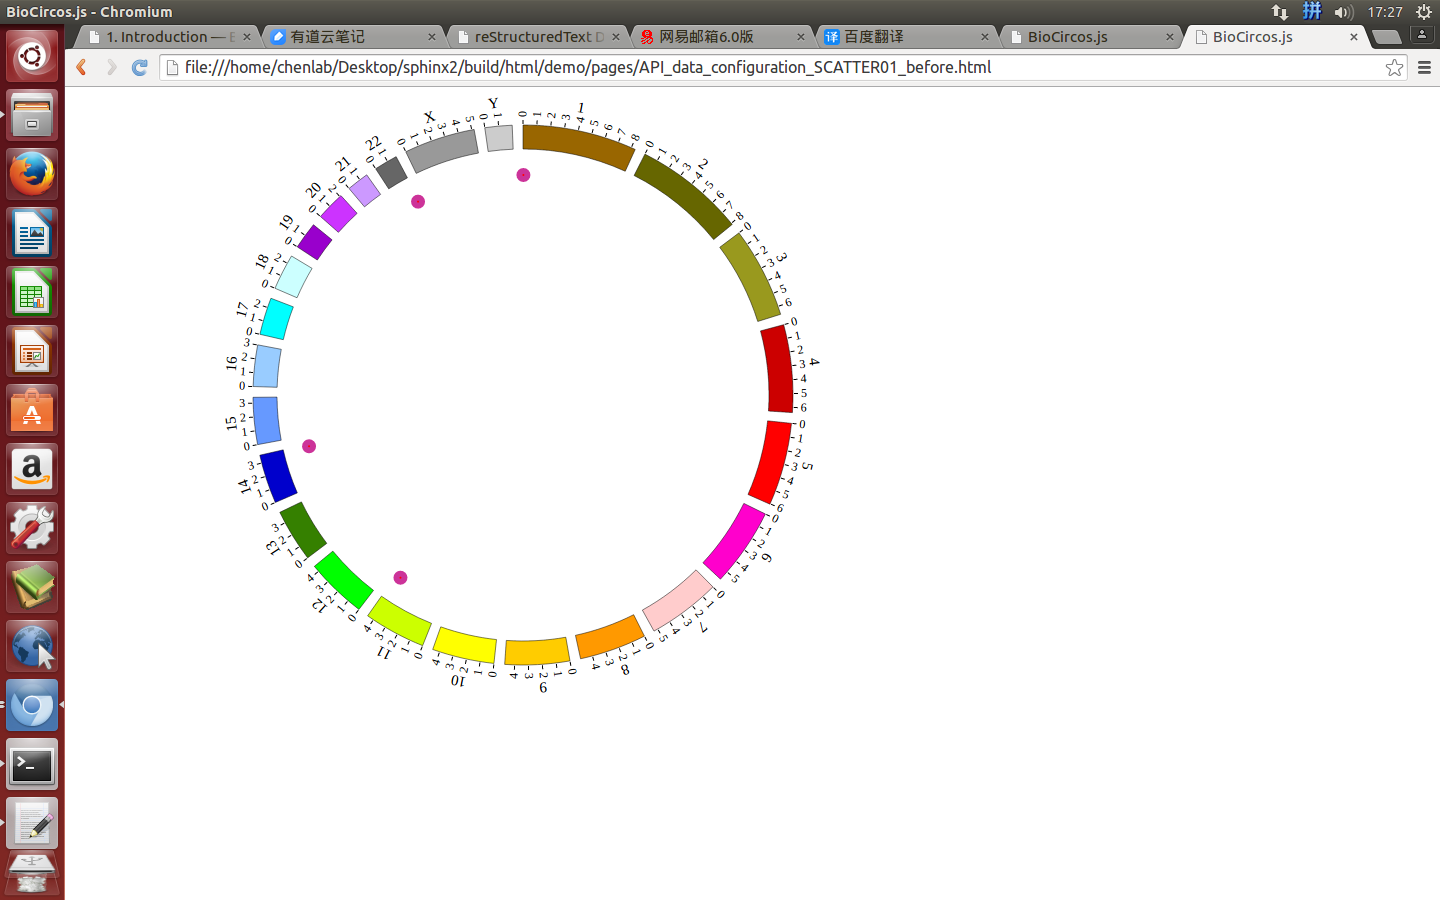
|
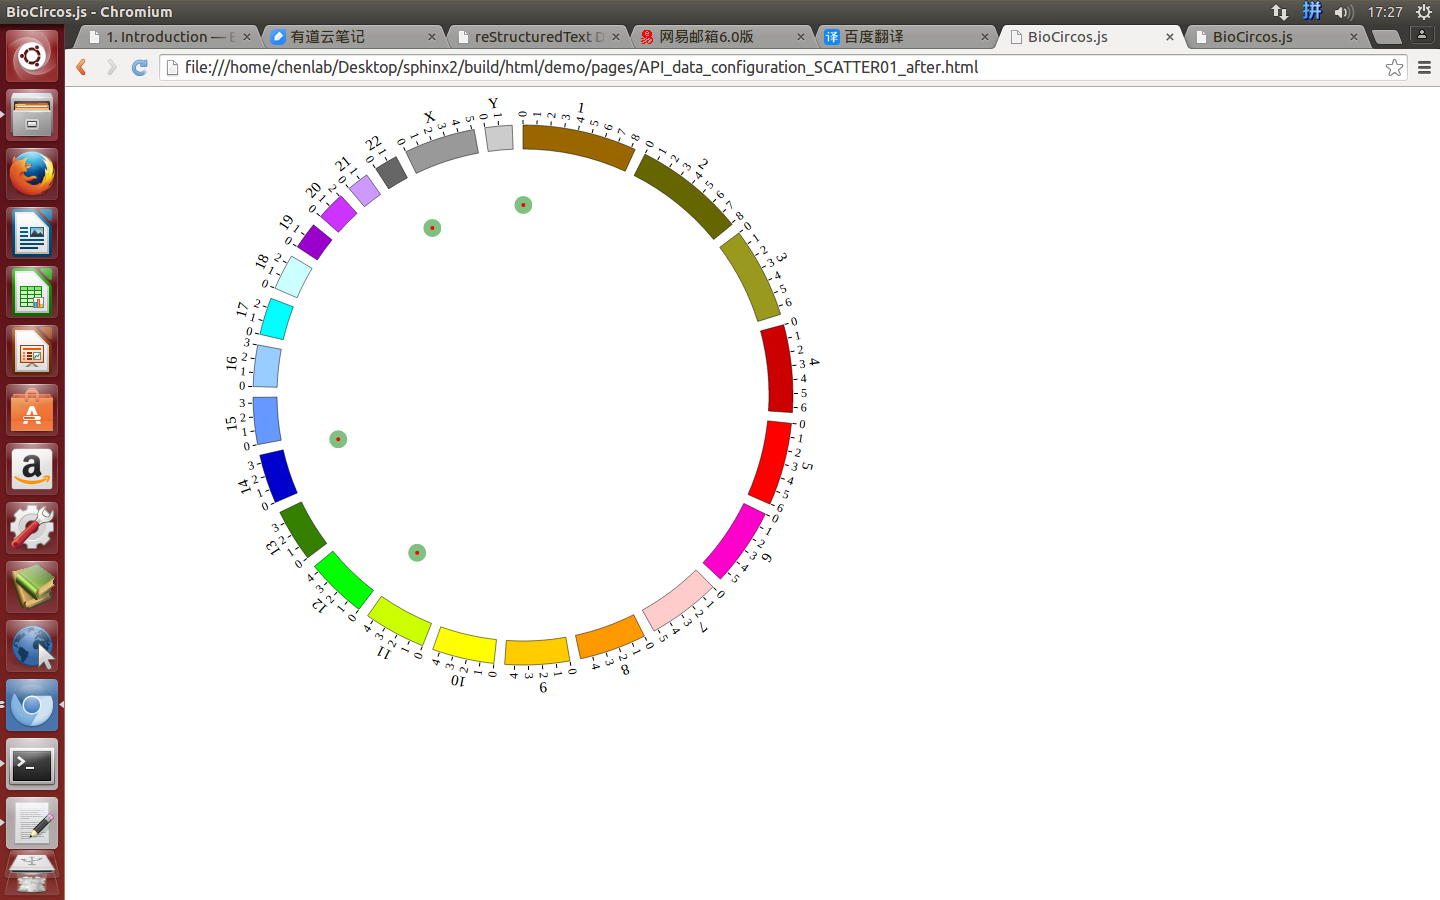
|
SCATTERAnimationDisplaydefault “false”, [true/false], open/not open animation event of SCATTER module
SCATTERAnimationTimedefault 2000, specifies the animation time in milliseconds.
SCATTERAnimationDelaydefault 20, specifies the animation delay in milliseconds.
SCATTERAnimationTypedefault “bounce”, [linear/circle/elastic/bounce], “linear” means ordinary linear change; “circle” means change to the final state of the animation; “elastic” means change to the final state with a bounce; “bounce” means bounce a few times in the final state.
Example: SCATTER Animation
| Example | Before | After |
|---|---|---|
| Code change | outerCircleColor: "#CC3399",
SCATTERAnimationDisplay: true,
SCATTERAnimationTime: 2000,
SCATTERAnimationDelay: 20,
SCATTERAnimationType: "bounce",
|
outerCircleColor: "green",
SCATTERAnimationDisplay: true,
SCATTERAnimationTime: 1000,
SCATTERAnimationDelay: 400,
SCATTERAnimationType: "circle",
|
| Image change | 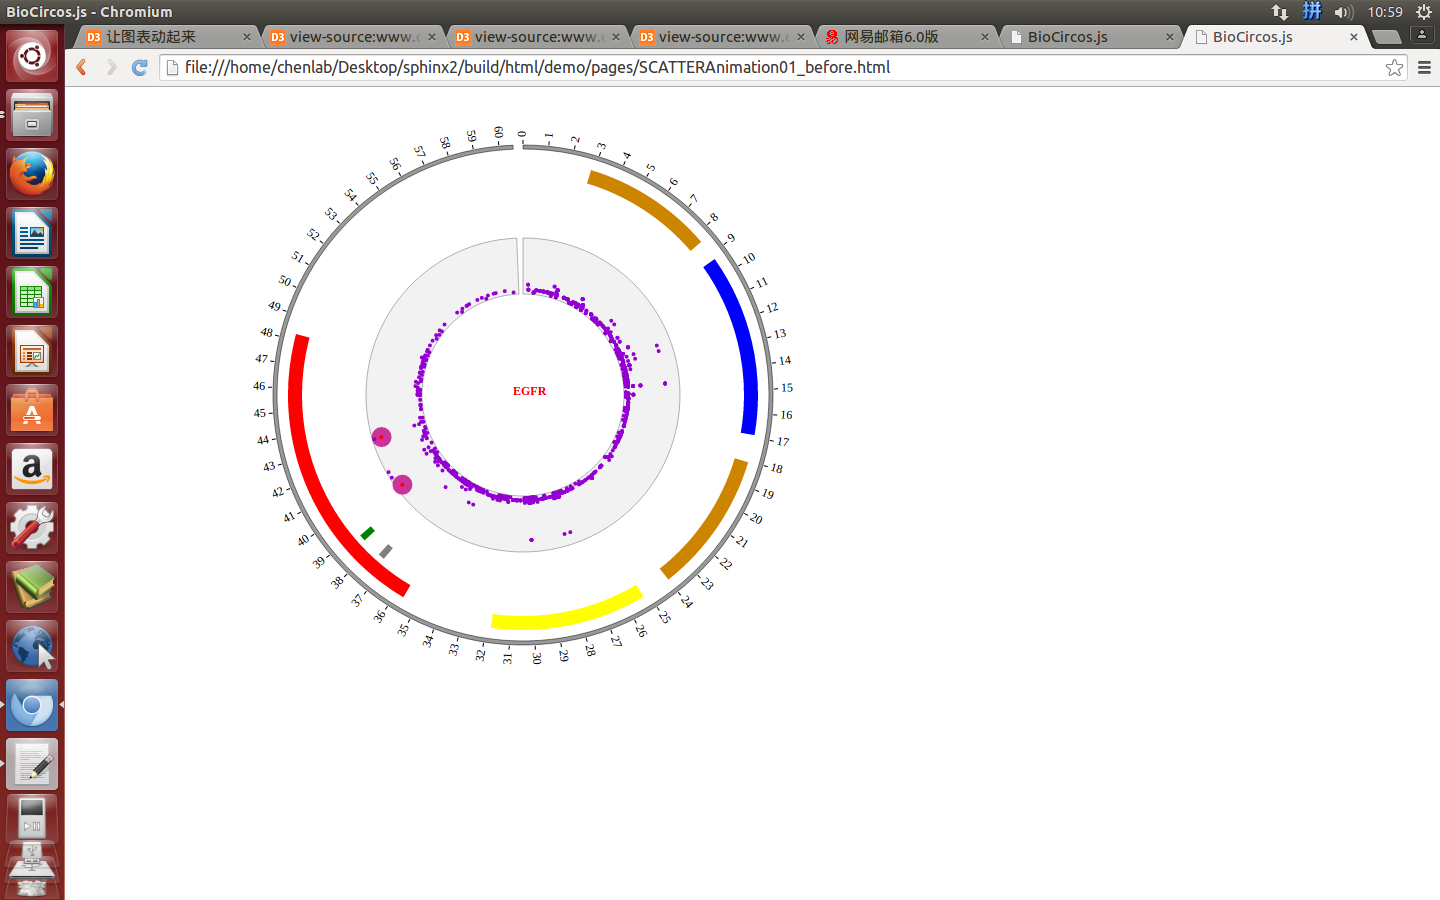
|
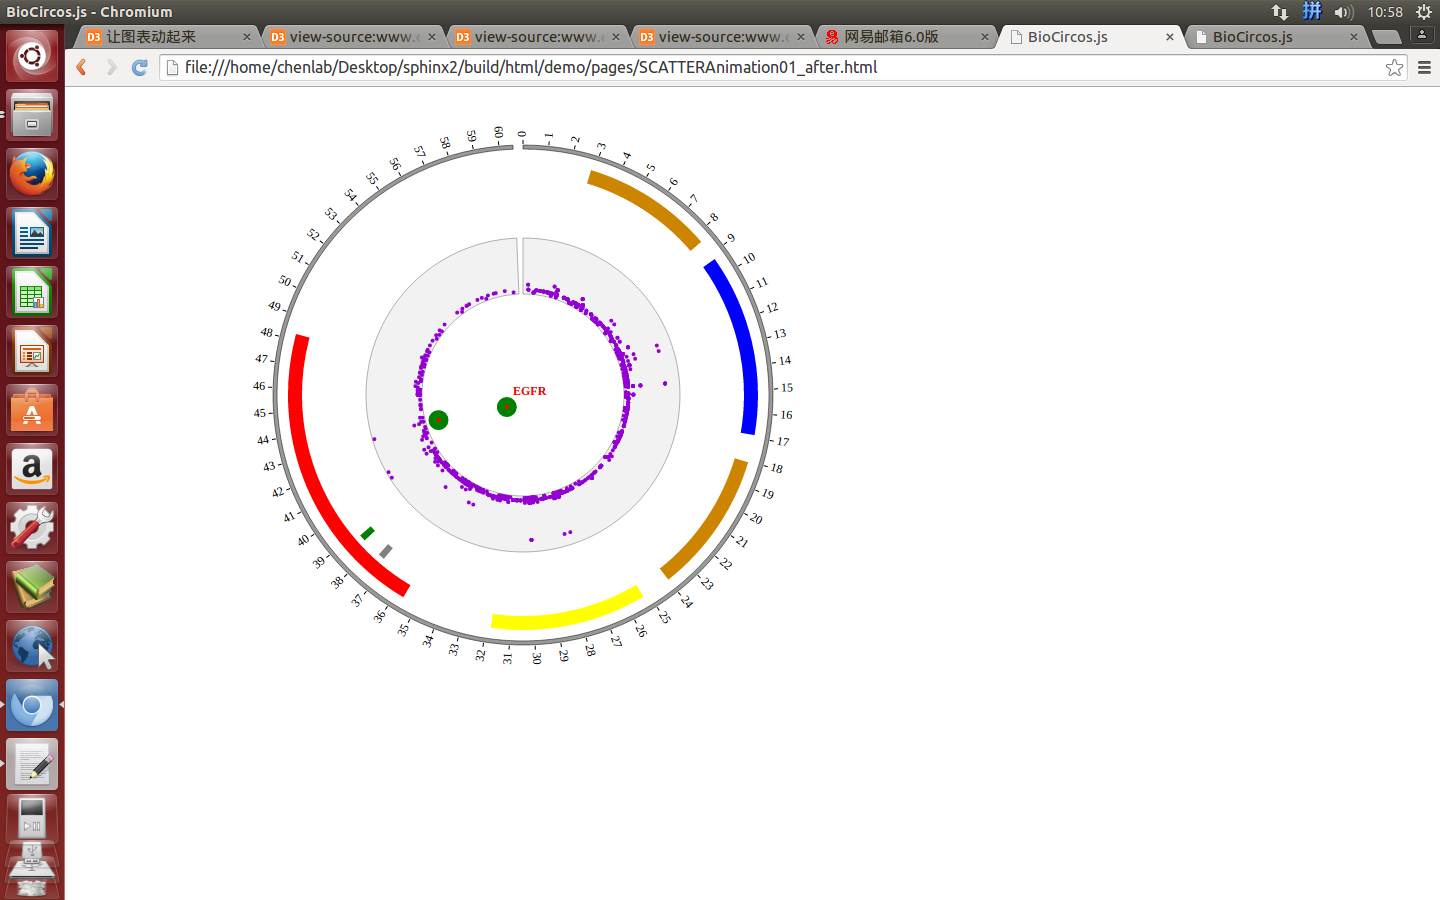
|
Part 2 : Data
- The 1 column(
chr) is the name of the chromosome. - The 2 column(
start) is the start position of the scatter. - The 3 column(
end) is the end position of the scatter. - The 4 column(
name) is the name of the scatter. - The 5 column(
des) is the description of the scatter.
6.3 LINK module
var LINK01 = [ "LINK01" , {
  LinkRadius: 140,
  LinkFillColor: "#F26223",
  LinkWidth: 3,
  displayLinkAxis: true,
  LinkAxisColor: "#B8B8B8",
  LinkAxisWidth: 0.5,
  LinkAxisPad: 3,
  displayLinkLabel: true,
  LinkLabelColor: "red",
  LinkLabelSize: 13,
  LinkLabelPad: 8,
} , [
  {fusion: "FGFR3--TACC3", g1chr: "4", g1start: "1795662", g1end: "1808986", g1name: "FGFR3", g2chr: "4", g2start: "1723217", g2end: "1746905", g2name: "TACC3"},
  {fusion: "CCDC6--RET", g1chr: "10", g1start: "43595894", g1end: "43623714", g1name: "RET", g2chr: "10", g2start: "61552678", g2end: "61666182", g2name: "TACC3"},
  {fusion: "ETV6--NTRK3", g1chr: "12", g1start: "11905384", g1end: "12043977", g1name: "ETV6", g2chr: "15", g2start: "88420169", g2end: "88799384", g2name: "NTRK3"},
  {fusion: "EGFR--SEPT14", g1chr: "7", g1start: "55086971", g1end: "55273307", g1name: "EGFR", g2chr: "7", g2start: "55861237", g2end: "55930482", g2name: "SEPT14"},
  {fusion: "EML4--ALK", g1chr: "2", g1start: "42472644", g1end: "42557344", g1name: "EML4", g2chr: "2", g2start: "29416093", g2end: "30143525", g2name: "ALK"},
  {fusion: "ABL1--BCR", g1chr: "9", g1start: "133589707", g1end: "133761067", g1name: "ABL1", g2chr: "22", g2start: "23523148", g2end: "23657706", g2name: "BCR"},
]];
Part 1 : Configuration
LinkRadiusdefault 140, radius of link circle
LinkFillColordefault “#F26223”, color of link
LinkWidthdefault 3, width of link
displayLinkAxisdefault true, [true/false], on/off link axis
LinkAxisColordefault “#B8B8B8”, color of link axis
LinkAxisWidthdefault 0.5, width of link axis
LinkAxisPaddefault 3, pad of link axis
displayLinkLabeldefault true, [true/false], on/off link label
LinkLabelColordefault “red”, color of link color
LinkLabelSizedefault 13, size of link label
LinkLabelPaddefault 8, pad of link label
Example: change data configuration of LINK module
| Example | Before | After |
|---|---|---|
| Code change | LinkRadius: 140,
LinkFillColor: "#F26223",
LinkAxisWidth: 0.5,
displayLinkLabel: true,
LinkLabelColor: "red",
LinkLabelSize: 13,
LinkLabelPad: 8,
|
LinkRadius: 170,
LinkFillColor: "red",
LinkAxisWidth: 3,
displayLinkLabel: false,
LinkLabelColor: "red",
LinkLabelSize: 13,
LinkLabelPad: 8,
|
| Image change | 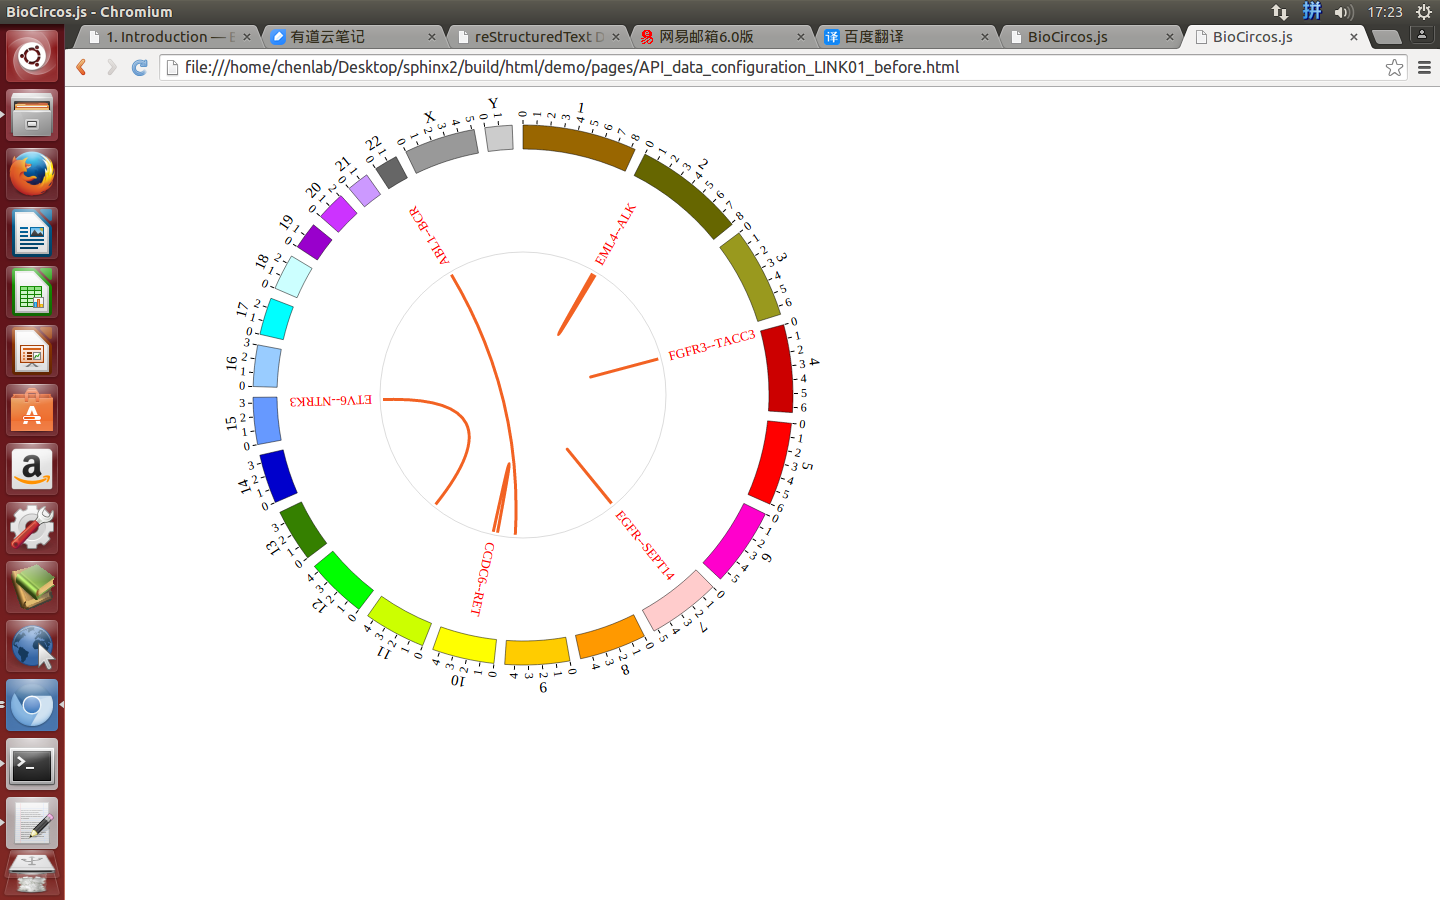
|
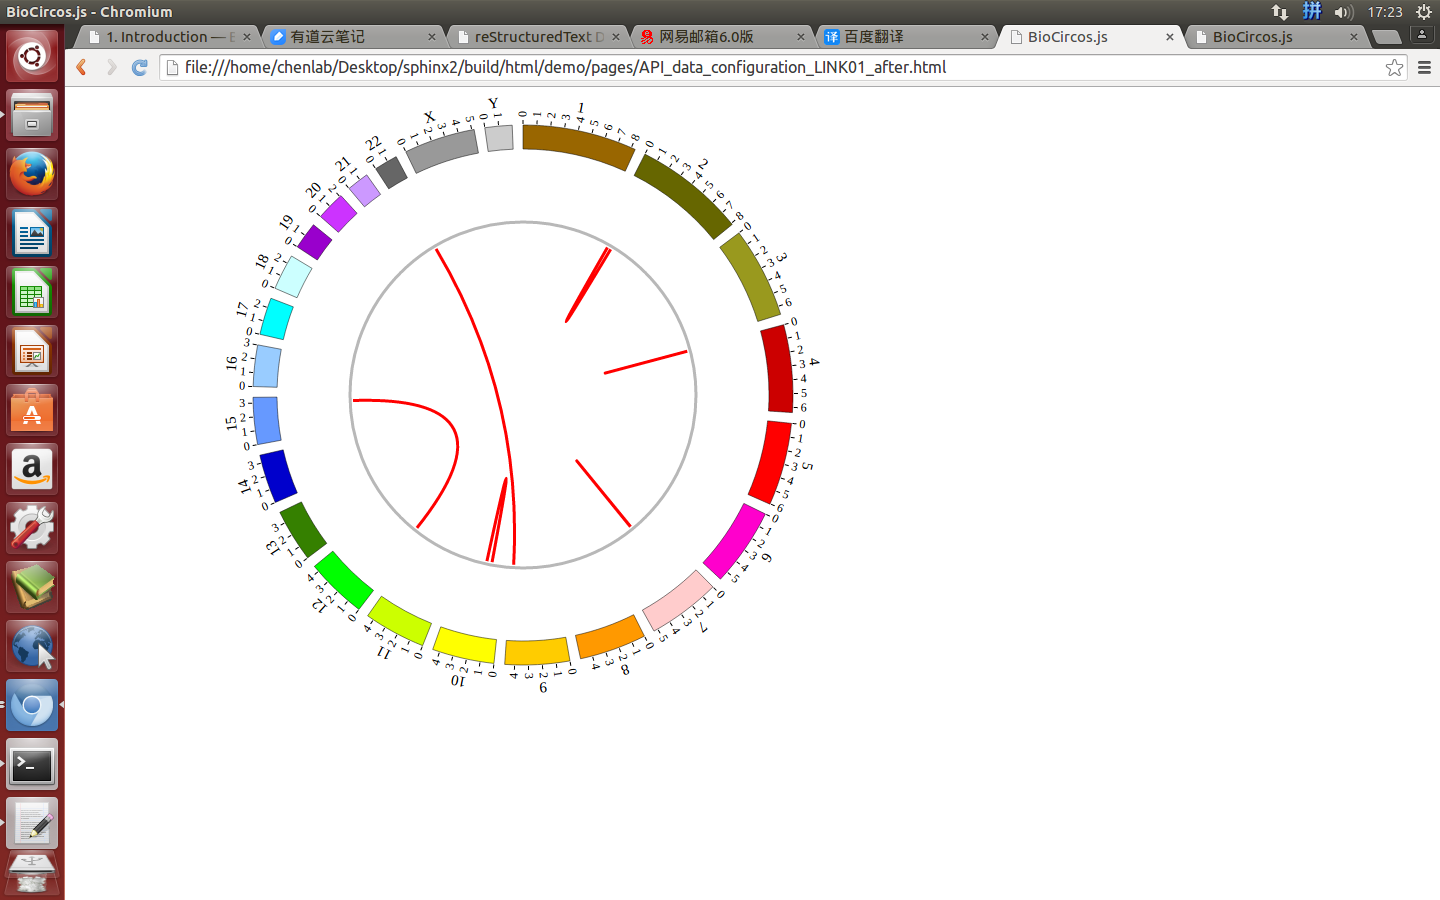
|
Part 2 : Data
- The 1 column(
name) is the name of the link. - The 2 column(
g1chr) is the chromosome of gene 1. - The 3 column(
g1start) is the start of gene 1. - The 4 column(
g1end) is the end of gene 1. - The 5 column(
g1name) is the name of gene 1. - The 6 column(
g2chr) is the chromosome of gene 2. - The 7 column(
g2start) is the start of gene 2. - The 8 column(
g2end) is the end of gene 2. - The 9 column(
g2name) is the name of gene 2.
6.4 CNV module
var CNV01 = [ "CNV01" , {
  maxRadius: 175,
  minRadius: 116,
  CNVwidth: 2,
  CNVColor: "#4876FF",
} , [
  {chr: "1", start: "764788", end: "87109267", value: "2.5"},
  {chr: "1", start: "87109268", end: "120217058", value: "2"},
  {chr: "1", start: "144101324", end: "222713034", value: "4"},
  {chr: "1", start: "222713035", end: "222867750", value: "6"},
  ......
  {chr: "9", start: "30330084", end: "140139368", value: "3.5"},
  {chr: "X", start: "105073", end: "114046817", value: "1"},
  {chr: "X", start: "114112404", end: "114299959", value: "2"},
  {chr: "X", start: "114376344", end: "154884814", value: "1"},
]];
Part 1 : Configuration
maxRadiusdefault 155, max radius to show CNVs with max vlaue
minRadiusdefault 116, min radius to show CNVs with min vlaue
CNVwidthdefault 2, CNV width
CNVColordefault “#4876FF”, CNV color
Example: change data configuration of CNV module
| Example | Before | After |
|---|---|---|
| Code change | CNVwidth: 2,
CNVColor: "#4876FF",
|
CNVwidth: 4,
CNVColor: "red",
|
| Image change | 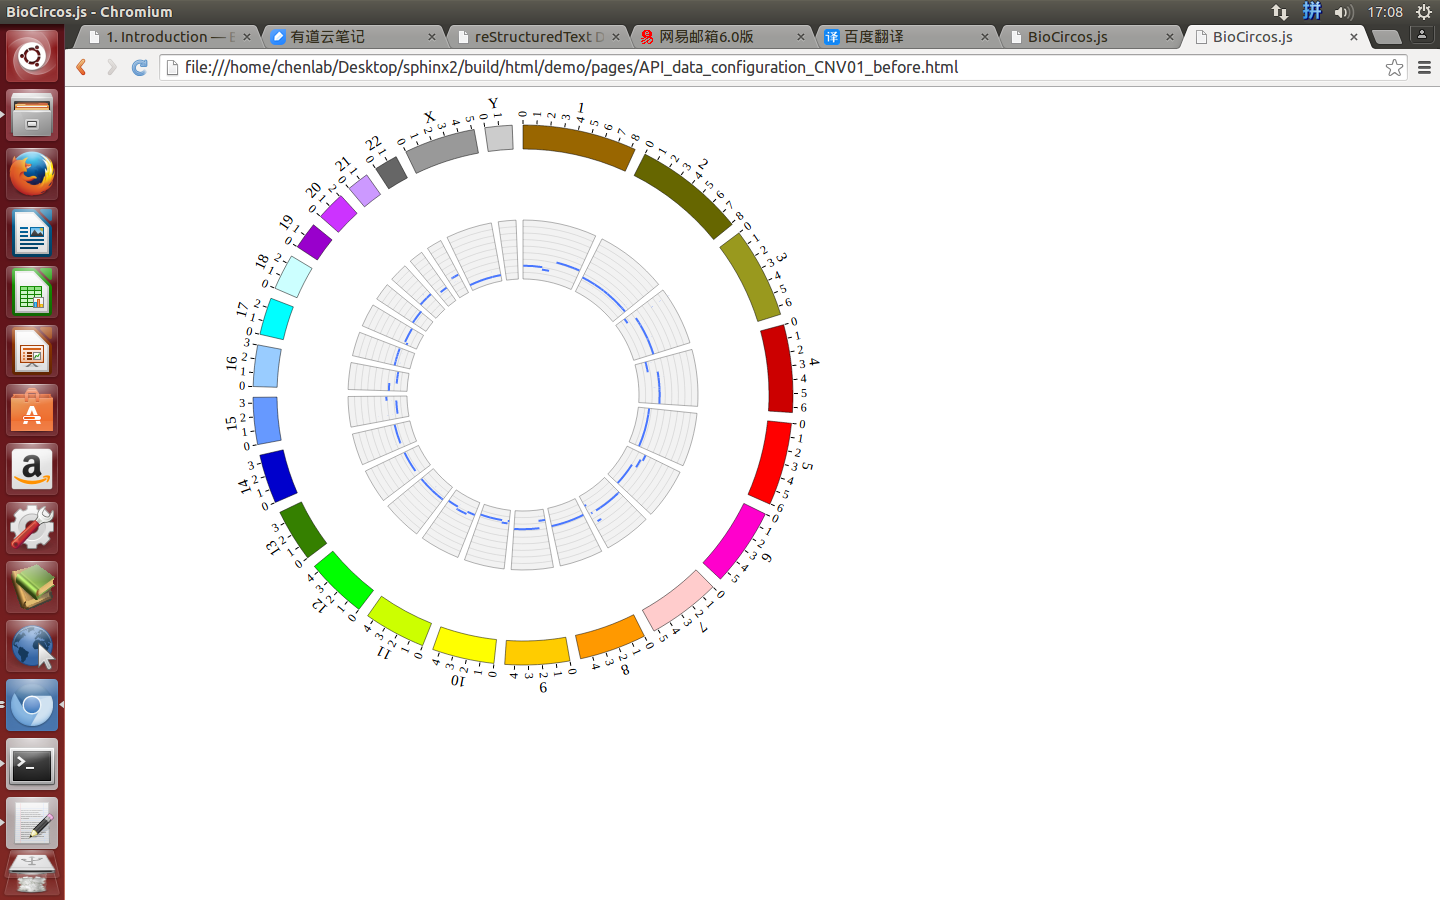
|
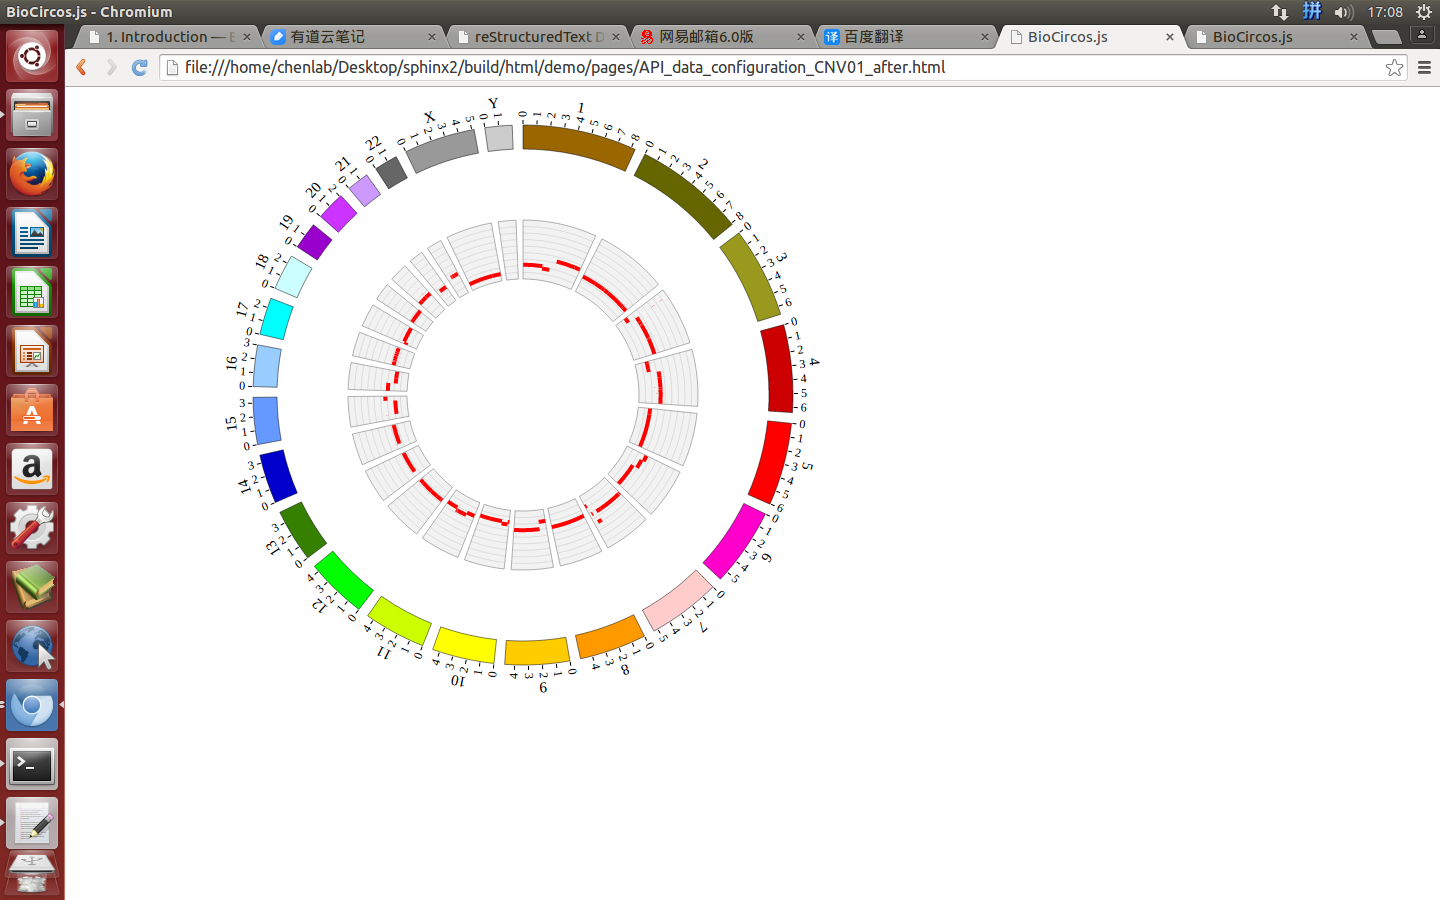
|
Part 2 : Data
- The 1 column(
chr) is the name of the chromosome. - The 2 column(
start) is the start of the CNV region. - The 3 column(
end) is the end of the CNV region. - The 4 column(
value) is the copy number of CNV region.
6.5 ARC module
var ARC01 = [ "ARC01" , {
  innerRadius: -55,
  outerRadius: -45,
} , [
  {chr: "EGFR", start: "57", end: "167", color: "#CD8500", des: "Recep_L domain"},
  {chr: "EGFR", start: "185", end: "338", color: "blue", des: "Furin-like domain"},
  {chr: "EGFR", start: "361", end: "480", color: "#CD8500", des: "Recep_L domain"},
  {chr: "EGFR", start: "505", end: "636", color: "yellow", des: "GF_recep_IV domain"},
  {chr: "EGFR", start: "713", end: "965", color: "red", des: "Pkinase Tyr domain"},
]];
Part 1 : Configuration
innerRadiusdefault -55, inner radius of arc
outerRadiusdefault -45, outer radius of arc
Example: change data configuration of ARC module
| Example | Before | After |
|---|---|---|
| Code change | innerRadius: -55,
outerRadius: -45,
|
innerRadius: 8,
outerRadius: -8,
|
| Image change | 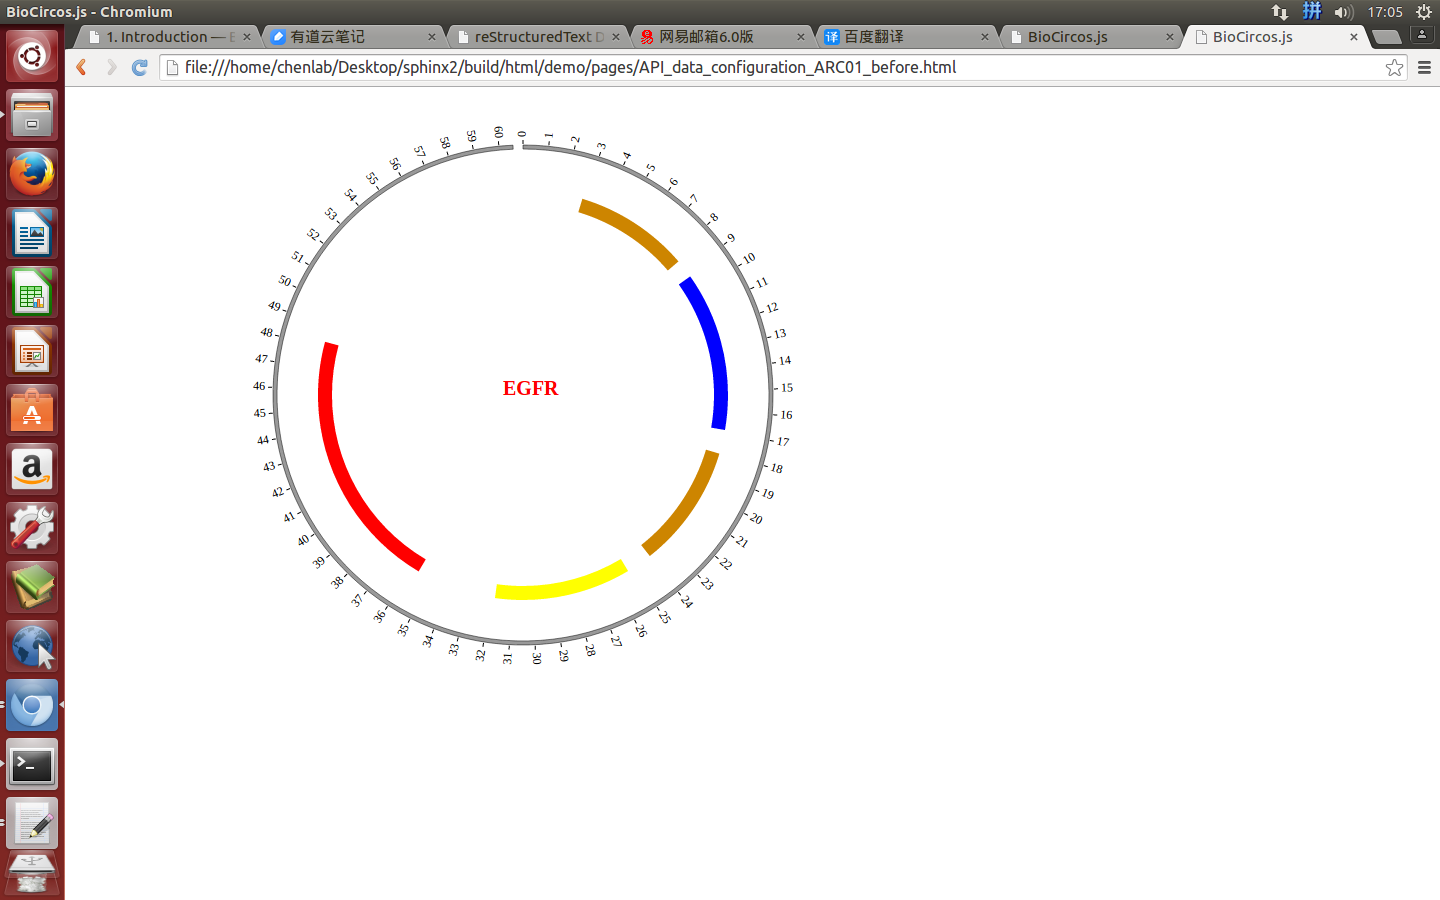
|
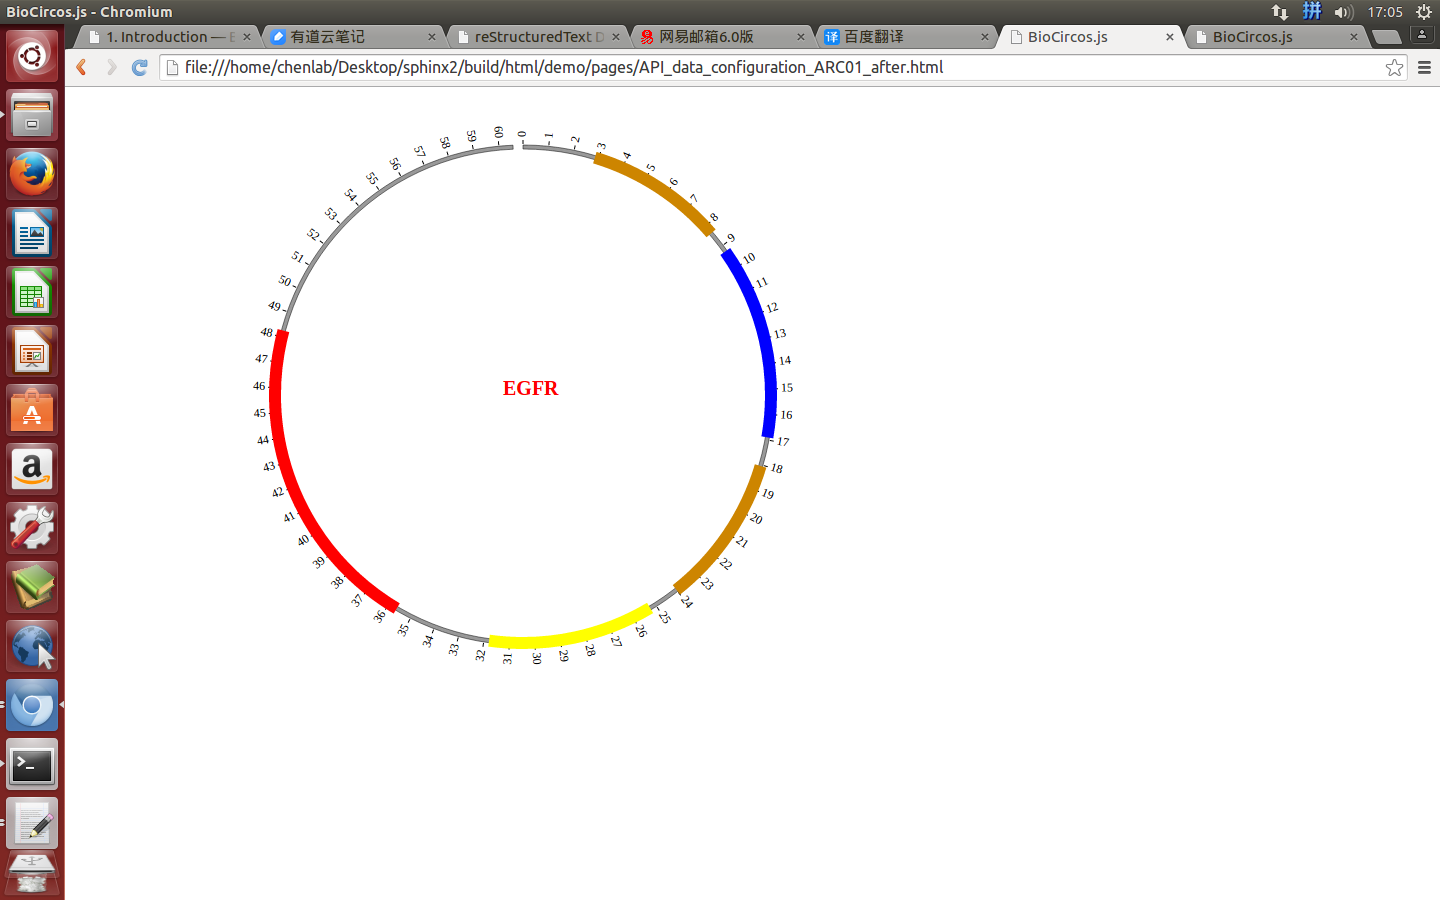
|
Part 2 : Data
- The 1 column(
chr) is the name of the chromosome. In this example, this field specify the protein name. - The 2 column(
start) is the start of the arc. - The 3 column(
end) is the end of the arc. - The 4 column(
color) is the color of the arc. - The 5 column(
des) is the description of the arc.
6.6 HEATMAP module
var HEATMAP01 = [ "HEATMAP01" , {
  innerRadius: -25,
  outerRadius: -65,
  maxColor: "red",
  minColor: "yellow"
} , [
  {chr: "2L", start: "1", end: "1011544", name: "test heatmap", value: "0.8"},
  {chr: "2L", start: "1011548", end: "2011544", name: "test heatmap", value: "0.3"},
  {chr: "2L", start: "2011548", end: "3011544", name: "test heatmap", value: "0.1"},
  {chr: "2L", start: "2011545", end: "2011546", name: "test heatmap", value: "0.01"},
......
  {chr: "X", start: "18011548", end: "19011544", name: "test heatmap", value: "0.83"},
  {chr: "X", start: "19011548", end: "20011544", name: "test heatmap", value: "0.39"},
  {chr: "X", start: "20011548", end: "21146708", name: "test heatmap", value: "0.49"},
  {chr: "X", start: "21011548", end: "22422827", name: "test heatmap", value: "0.83"},
]];
Part 1 : Configuration
innerRadiusdefault -25, inner radius of heatmap
outerRadiusdefault -65, outer radius of heatmap
maxColordefault “red”, color to show max value in heatmap
minColordefault “yellow”, color to show min value in heatmap
Example: change data configuration of HEATMAP module
| Example | Before | After |
|---|---|---|
| Code change | innerRadius: -25,
outerRadius: -65,
maxColor: "red",
minColor: "yellow"
|
innerRadius: -65,
outerRadius: -115,
maxColor: "red",
minColor: "green"
|
| Image change | 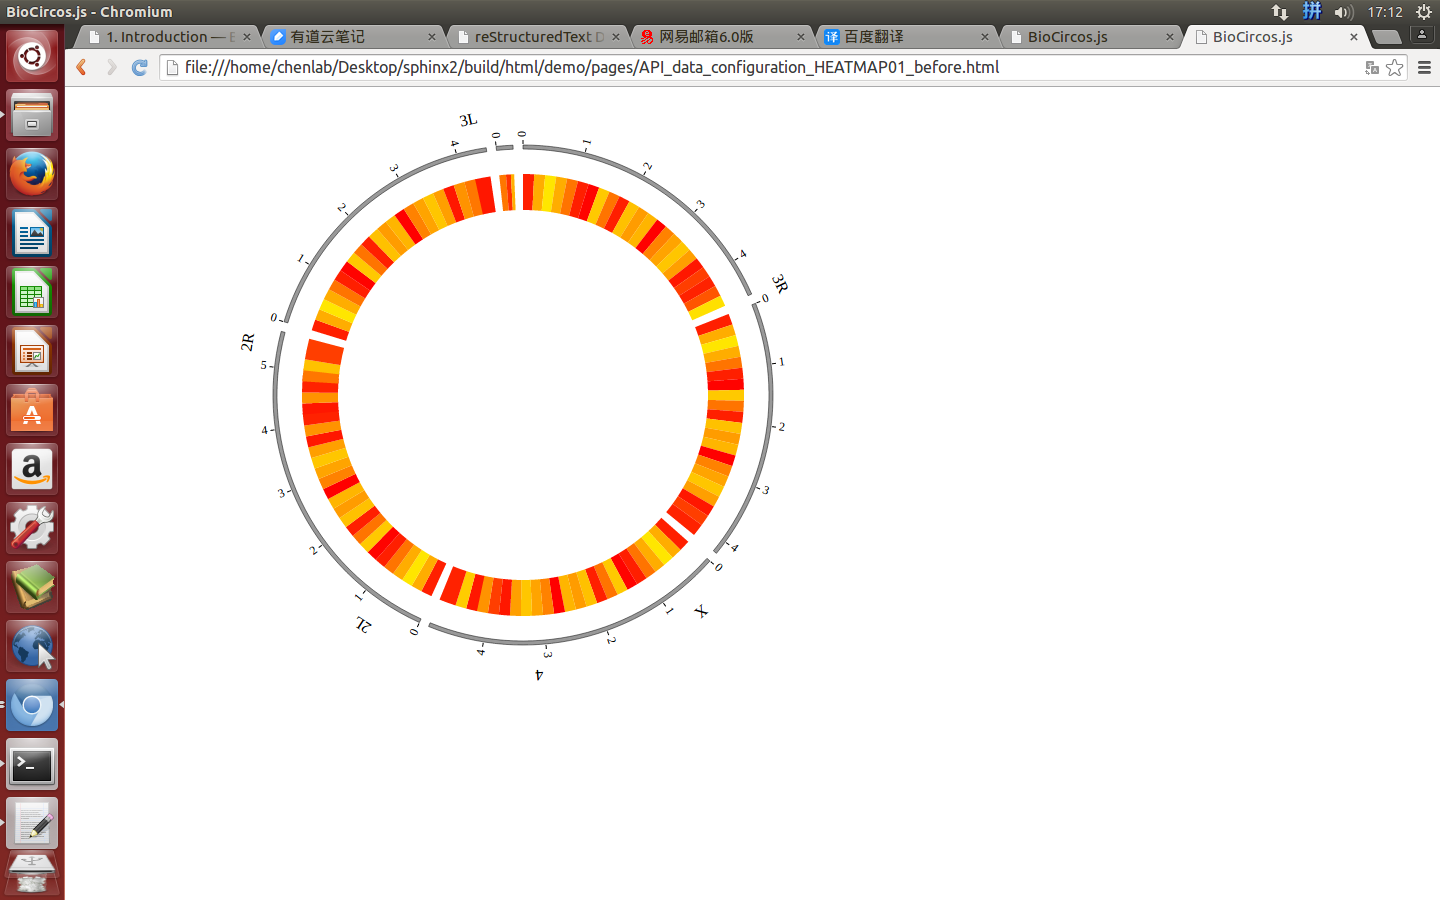
|
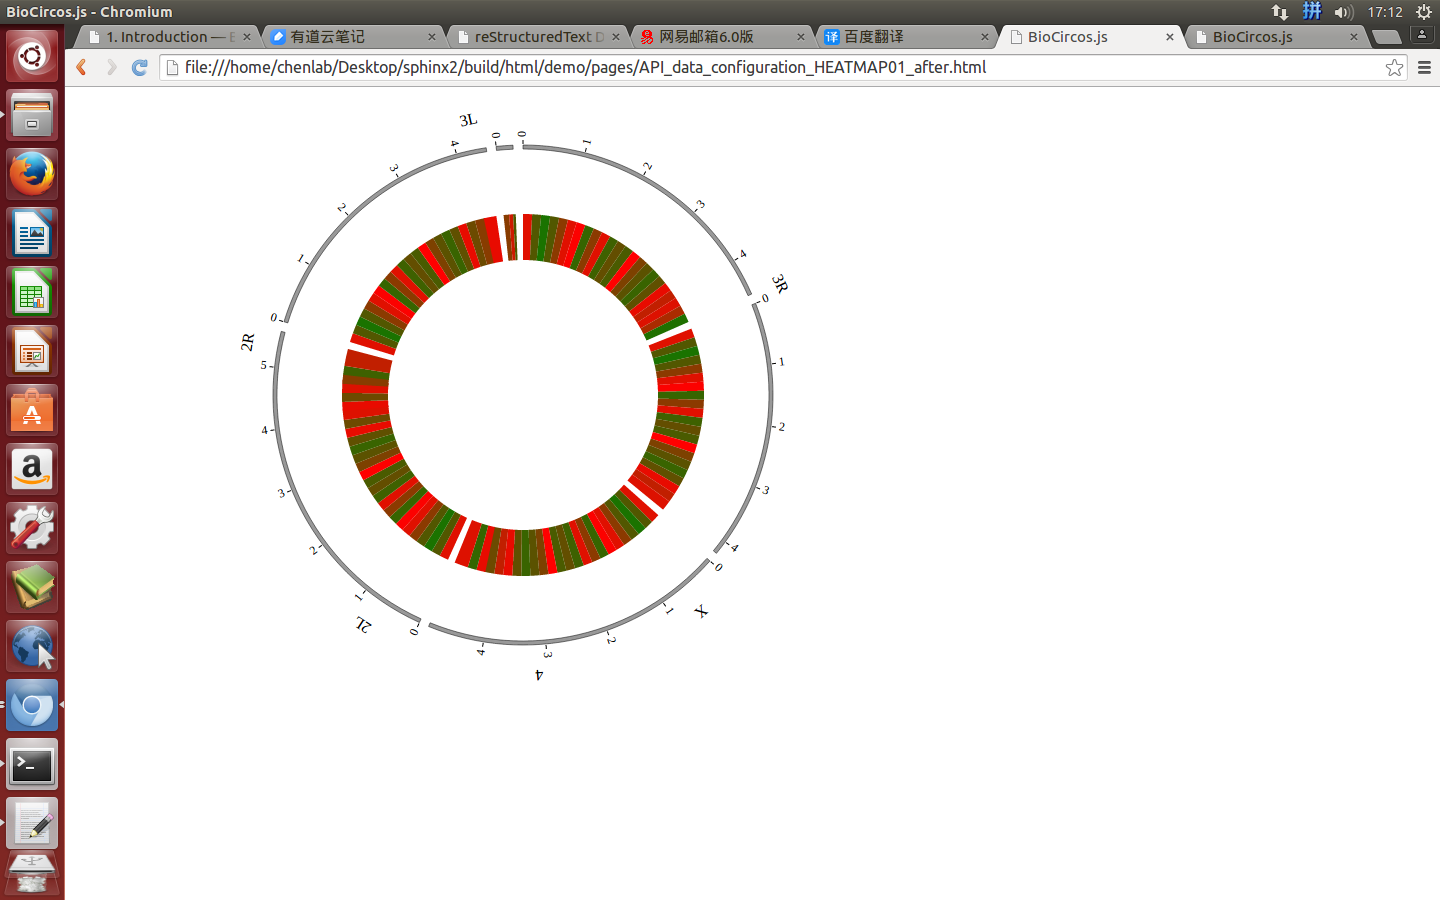
|
Part 2 : Data
- The 1 column(
chr) is the name of the chromosome. - The 2 column(
start) is the start of the region. - The 3 column(
end) is the end of the region. - The 4 column(
name) is the name of the region. - The 5 column(
value) is the value of the region.
6.7 HISTOGRAM module
var HISTOGRAM01 = [ "HISTOGRAM01" , {
  maxRadius: 220,
  minRadius: 185,
  histogramFillColor: "#FF6666",
} , [
  {chr: "2L", start: "1", end: "1011544", name: "test histogram", value: "0.8"},
  {chr: "2L", start: "1011548", end: "2011544", name: "test histogram", value: "0.3"},
  {chr: "2L", start: "2011548", end: "3011544", name: "test histogram", value: "0.1"},
  {chr: "2L", start: "2011545", end: "2011546", name: "test histogram", value: "0.01"},
  ......
  {chr: "X", start: "18011548", end: "19011544", name: "test histogram", value: "0.83"},
  {chr: "X", start: "19011548", end: "20011544", name: "test histogram", value: "0.39"},
  {chr: "X", start: "20011548", end: "21146708", name: "test histogram", value: "0.49"},
  {chr: "X", start: "21011548", end: "22422827", name: "test histogram", value: "0.83"},
]];
Part 1 : Configuration
maxRadiusdefault 240, max radius to show HISTOGRAM with max vlaue
minRadiusdefault 205, min radius to show HISTOGRAM with min vlaue
histogramFillColordefault “#FF6666”, color of histogram
Example: change data configuration of HISTOGRAM module
| Example | Before | After |
|---|---|---|
| Code change | maxRadius: 220,
minRadius: 185,
histogramFillColor: "#FF6666",
|
maxRadius: 170,
minRadius: 135,
histogramFillColor: "green",
|
| Image change | 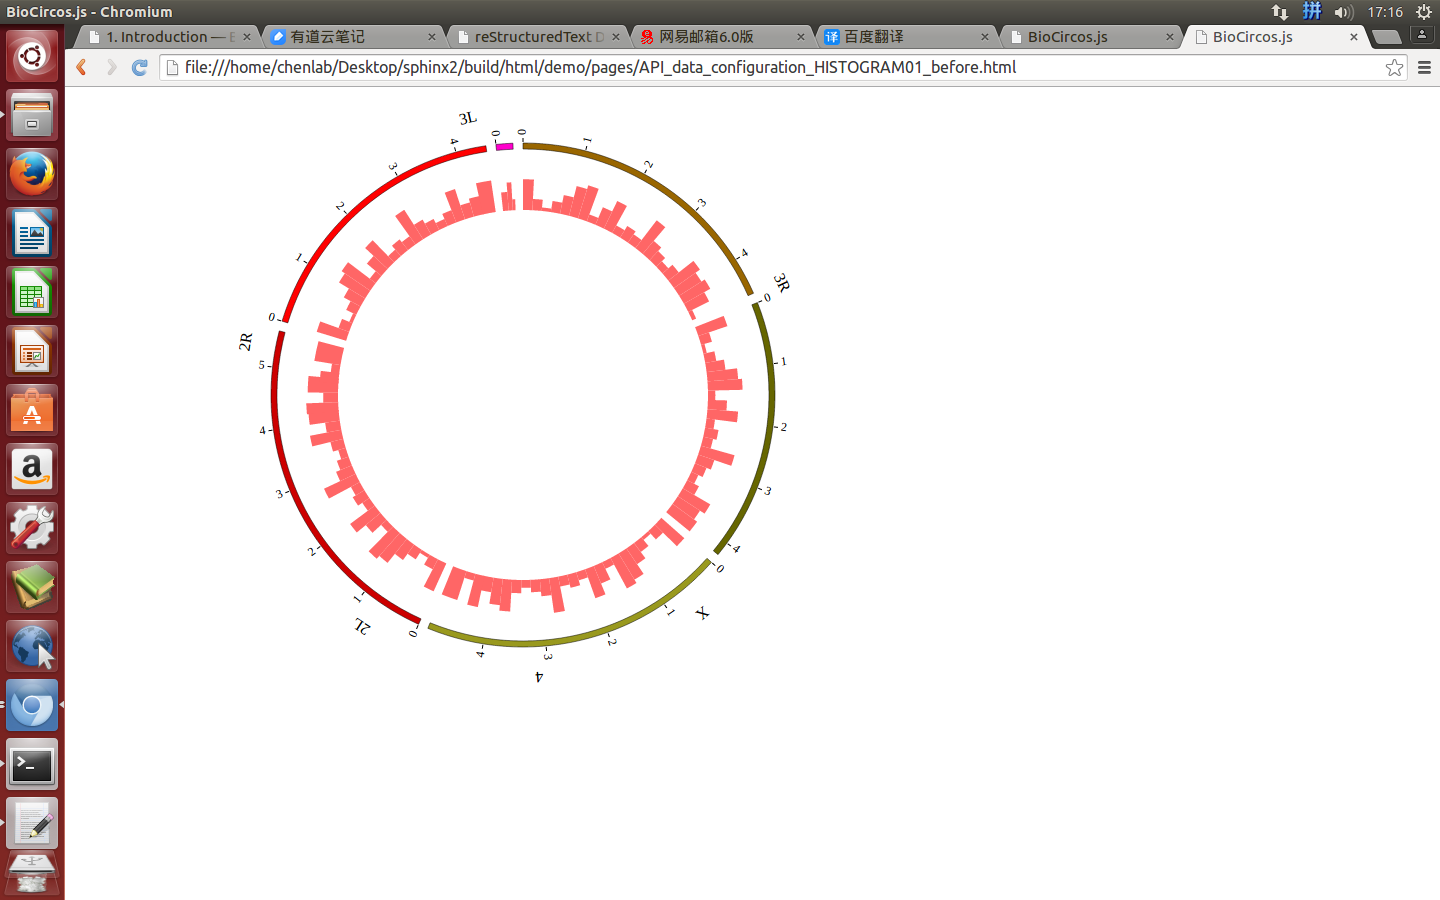
|
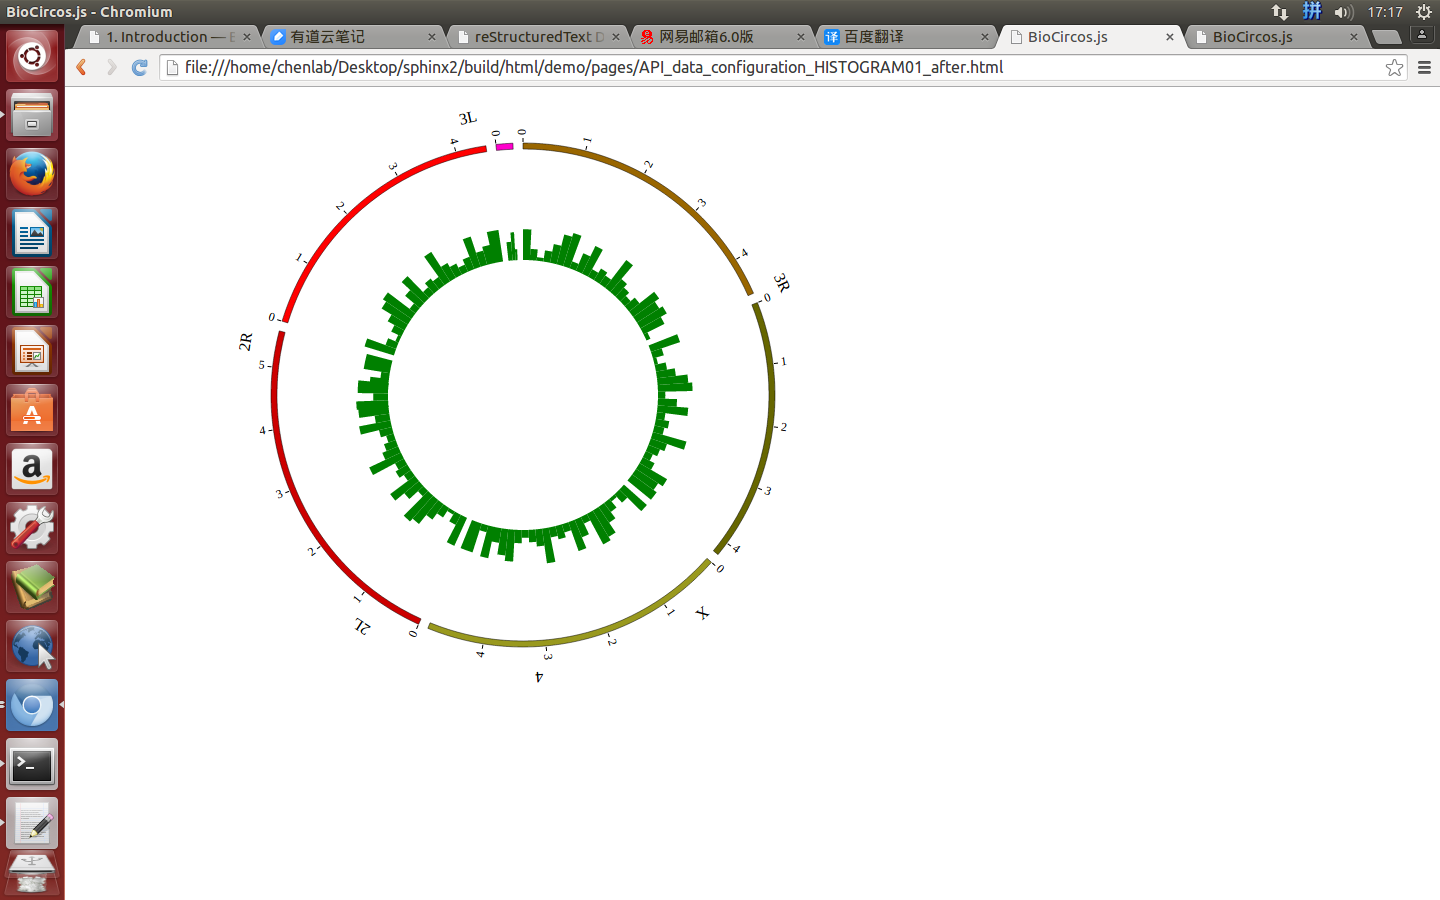
|
Part 2 : Data
- The 1 column(
chr) is the name of the chromosome. - The 2 column(
start) is the start of the region. - The 3 column(
end) is the end of the region. - The 4 column(
name) is the name of the region. - The 5 column(
value) is the value of the region.
6.8 LINE module
var LINE01 = [ "LINE01" , {
  maxRadius: 220,
  minRadius: 170,
  LineColor: "#EEAD0E",
  LineWidth: 2,
} , [
  {chr: "1", pos: "813468", value: "0.5"},
  {chr: "1", pos: "3383745", value: "0.22385"},
  {chr: "1", pos: "6157646", value: "0.238643"},
  {chr: "1", pos: "24793116", value: "0.876947"},
  ......
  {chr: "X", pos: "136860114", value: "0.267261"},
  {chr: "X", pos: "138413104", value: "0.847613"},
  {chr: "X", pos: "149344414", value: "0.830811"},
  {chr: "X", pos: "154203563", value: "0.43466"},
]];
Part 1 : Configuration
maxRadiusdefault 220, max radius to show LINE with max vlaue
minRadiusdefault 170, min radius to show LINE with min vlaue
LineFillColordefault “#EEAD0E”, color of line
LineWidthdefault 2, width of line
Example: change data configuration of LINE module
| Example | Before | After |
|---|---|---|
| Code change | LineColor: "#EEAD0E",
LineWidth: 2,
|
LineColor: "green",
LineWidth: 1,
|
| Image change | 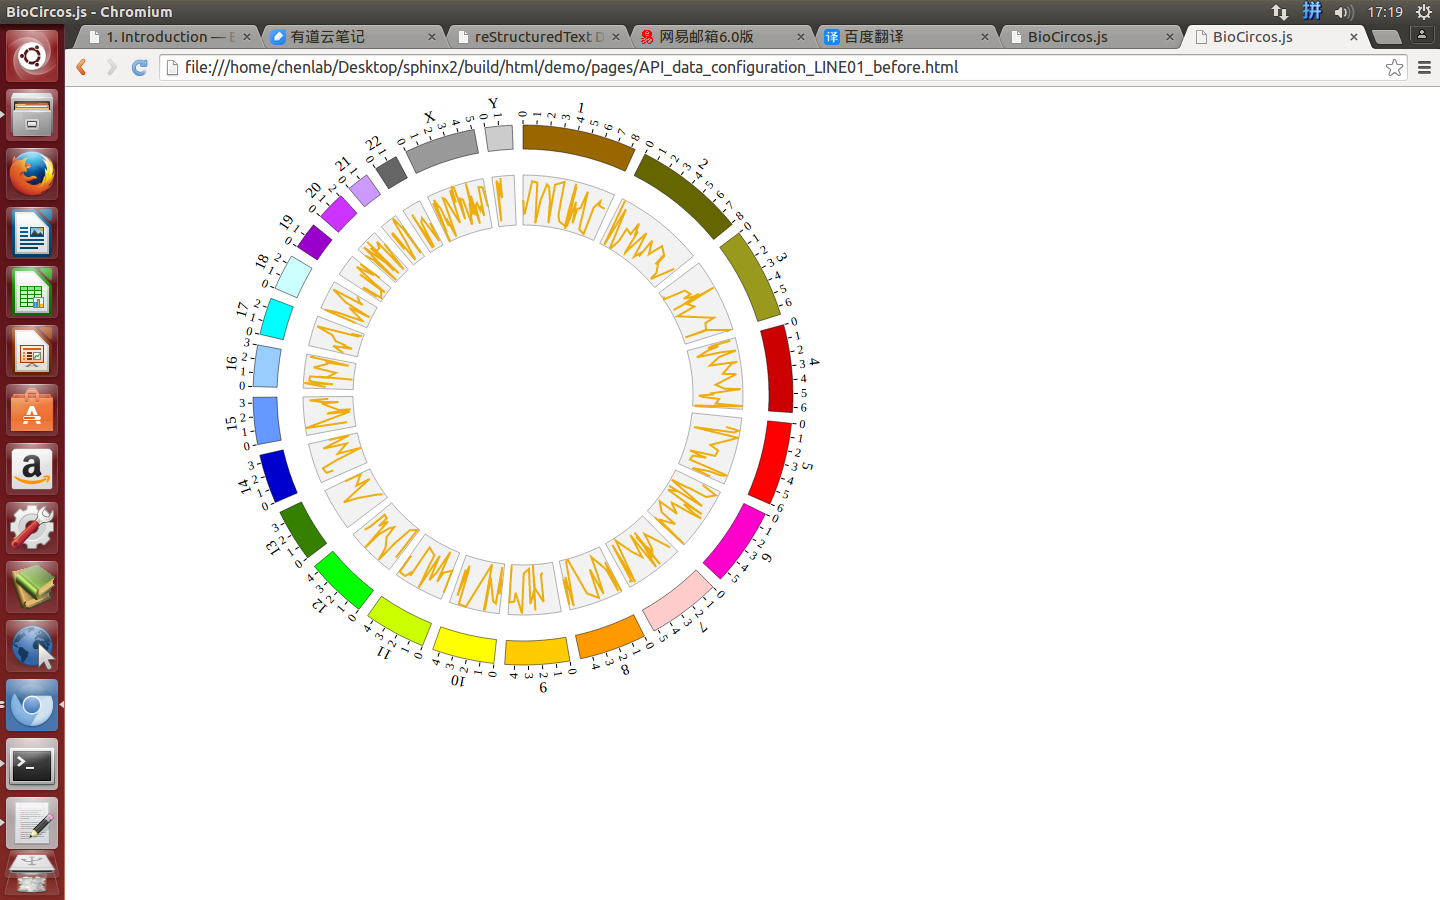
|
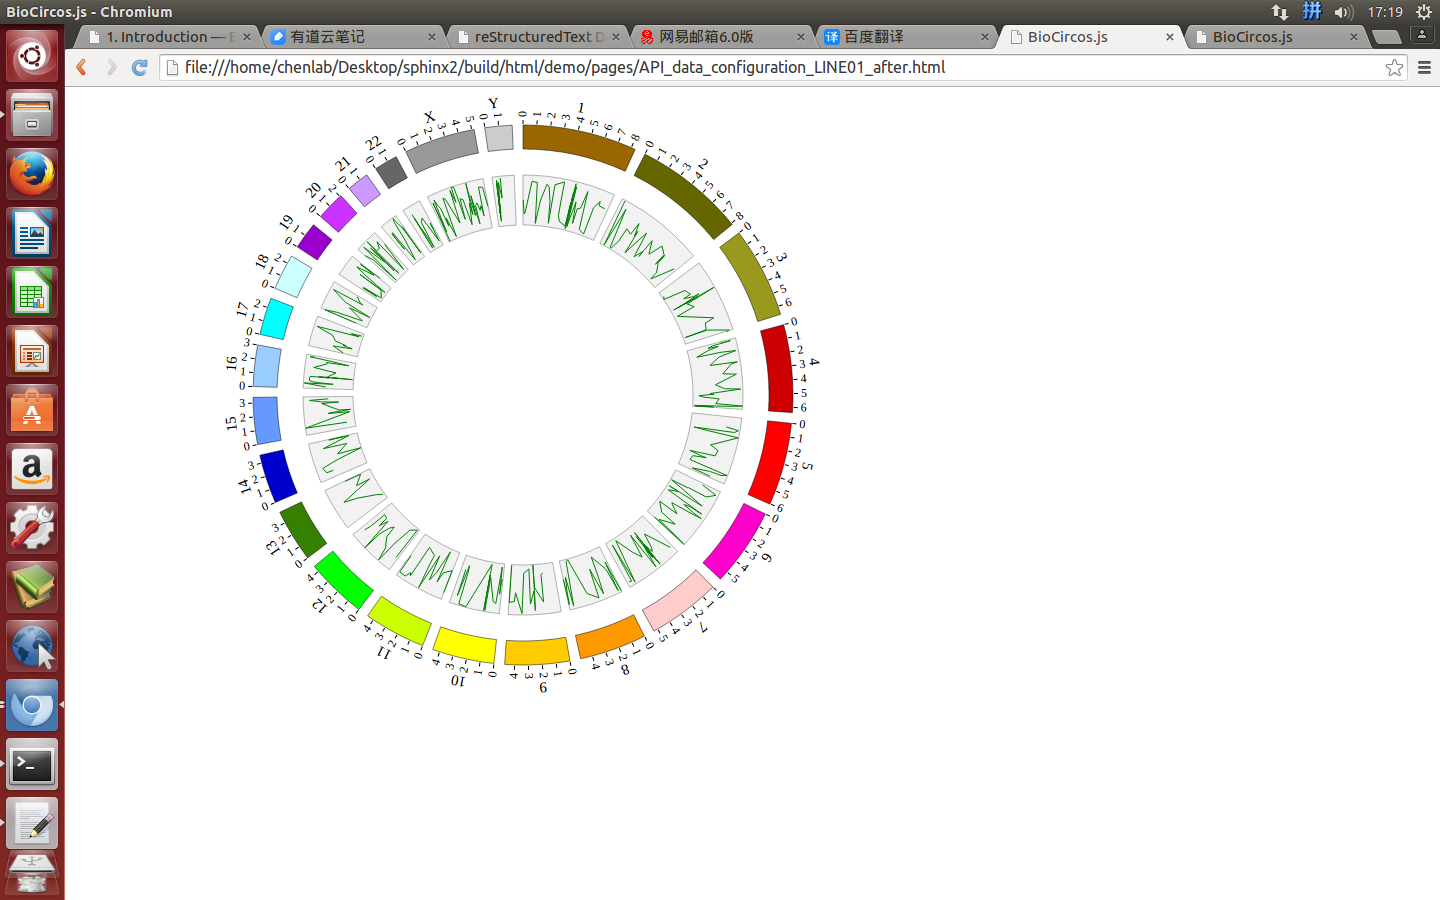
|
Part 2 : Data
- The 1 column(
chr) is the name of the chromosome. - The 2 column(
pos) is the position of the point. - The 3 column(
value) is the value of the point.
6.9 BACKGROUND module
<script>
var BACKGROUND01 = [ "BACKGROUND01" , {
  BginnerRadius: 230,
  BgouterRadius: 200,
  BgFillColor: "#F2F2F2",
  BgborderColor : "#000",
  BgborderSize : 0.3,
  axisShow: "true",
  axisWidth: 0.1,
  axisColor: "#000",
  axisOpacity: 0.5,
  axisNum: 8
}];
</script>
Part 1 : Configuration
BginnerRadiusdefault 230, inner radius of background
BgouterRadiusdefault 200, outer radius of background
BgFillColordefault “#F2F2F2”, color of background
BgborderColordefault “#000”, color of background border
BgborderSizedefault 0.3, size of background border
axisShowdefault false, [true/false], on/off background axis
axisWidthdefault 0.1, width of axis
axisColordefault “#000”, color of background axis
axisOpacitydefault 0.5, opacity of axis
axisNumdefault 8, number of axis
Example: change data configuration of BACKGROUND module
| Example | Before | After |
|---|---|---|
| Code change | BginnerRadius: 200,
BgouterRadius: 150,
BgborderSize : 0.3,
axisShow: "false",
axisWidth: 0.1,
axisColor: "#000",
axisNum: 8
|
BginnerRadius: 190,
BgouterRadius: 100,
BgborderSize : 0.4,
axisShow: "true",
axisWidth: 0.2,
axisColor: "red",
axisNum: 5
|
| Image change | 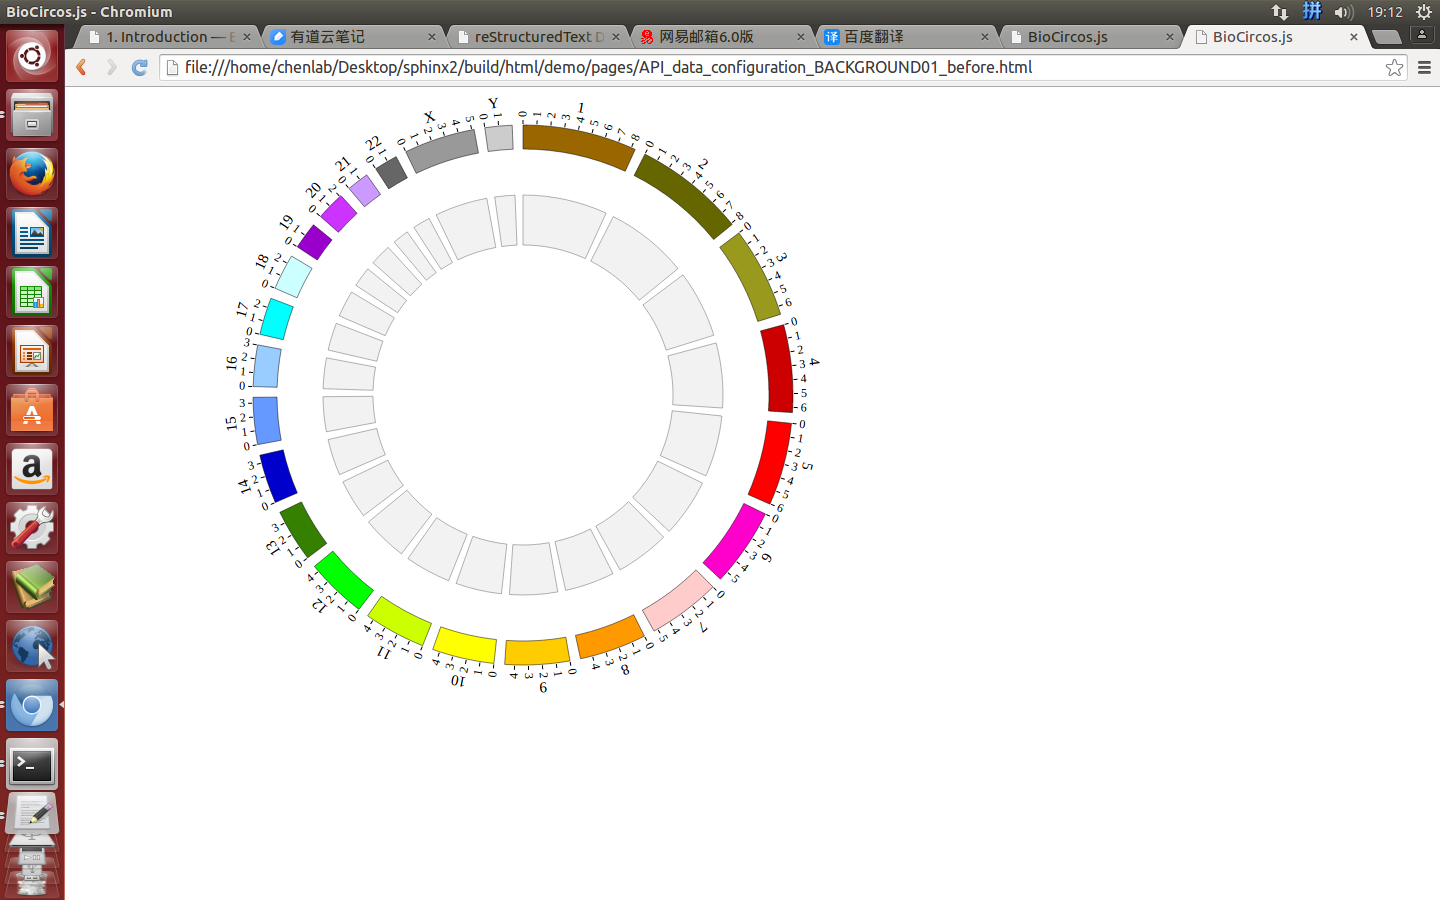
|
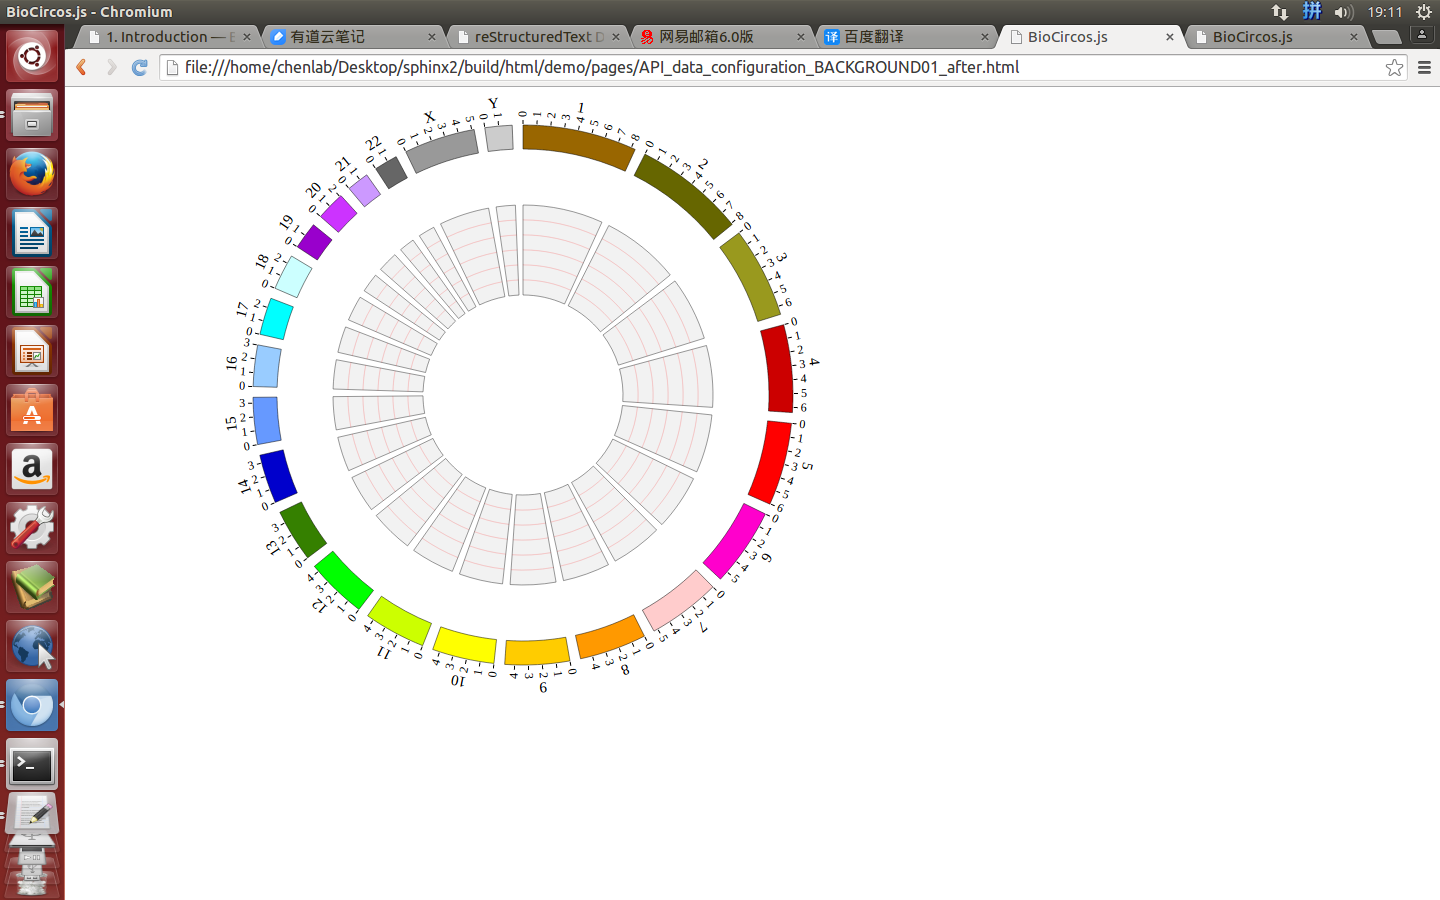
|
6.10 TEXT module
<script>
  var TEXT01 = [ "TEXT01" , {
     x: -20,
     y: 0,
     textSize: 20,
     textWeight: "bold",
     textColor: "red",
     textOpacity: 1.0,
     text: "EGFR"
  }];
</script>
Part 1 : Configuration
xdefault -20, x of text
ydefault 0, y of text
textSizedefault 20, font-size of text
textWeightdefault “bold”, normal,bold,bolder,lighter,100,200,300,400,500,600,700,800,900
textColordefault “red”, color of text
textOpacitydefault 1.0, opacity of text
textSizedefault “TEXT”, text content
Example: change data configuration of TEXT module
| Example | Before | After |
|---|---|---|
| Code change | x: -20,
y: 0,
textSize: 20,
textWeight: "bold",
textColor: "red",
textOpacity: 1.0,
text: "EGFR"
|
x: -60,
y: 1,
textSize: 18,
textWeight: "300",
textColor: "green",
textOpacity: 0.9,
text: "EGFR - Mutations"
|
| Image change | 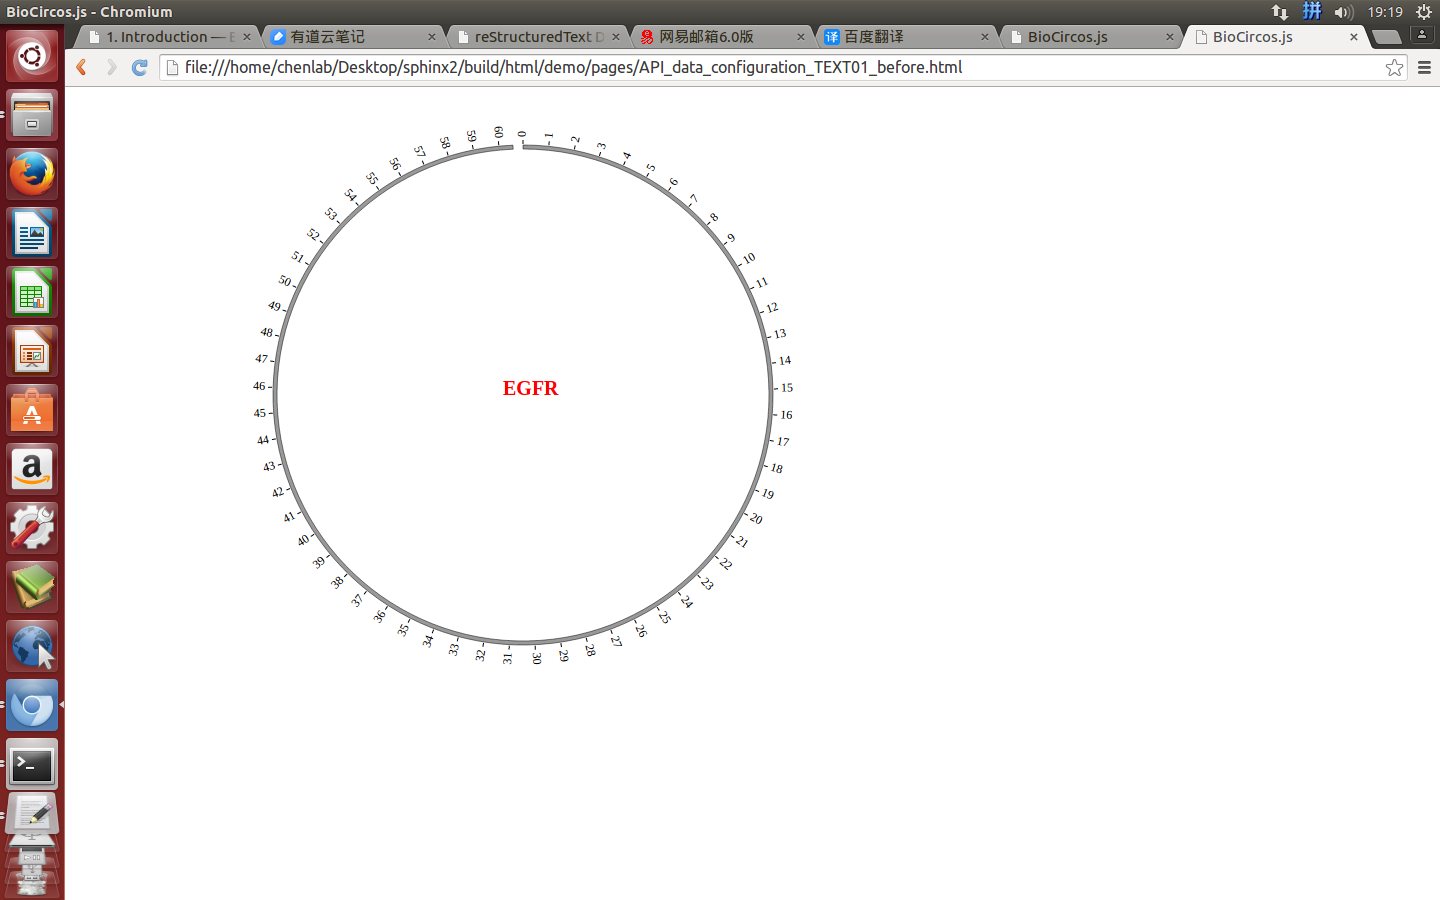
|
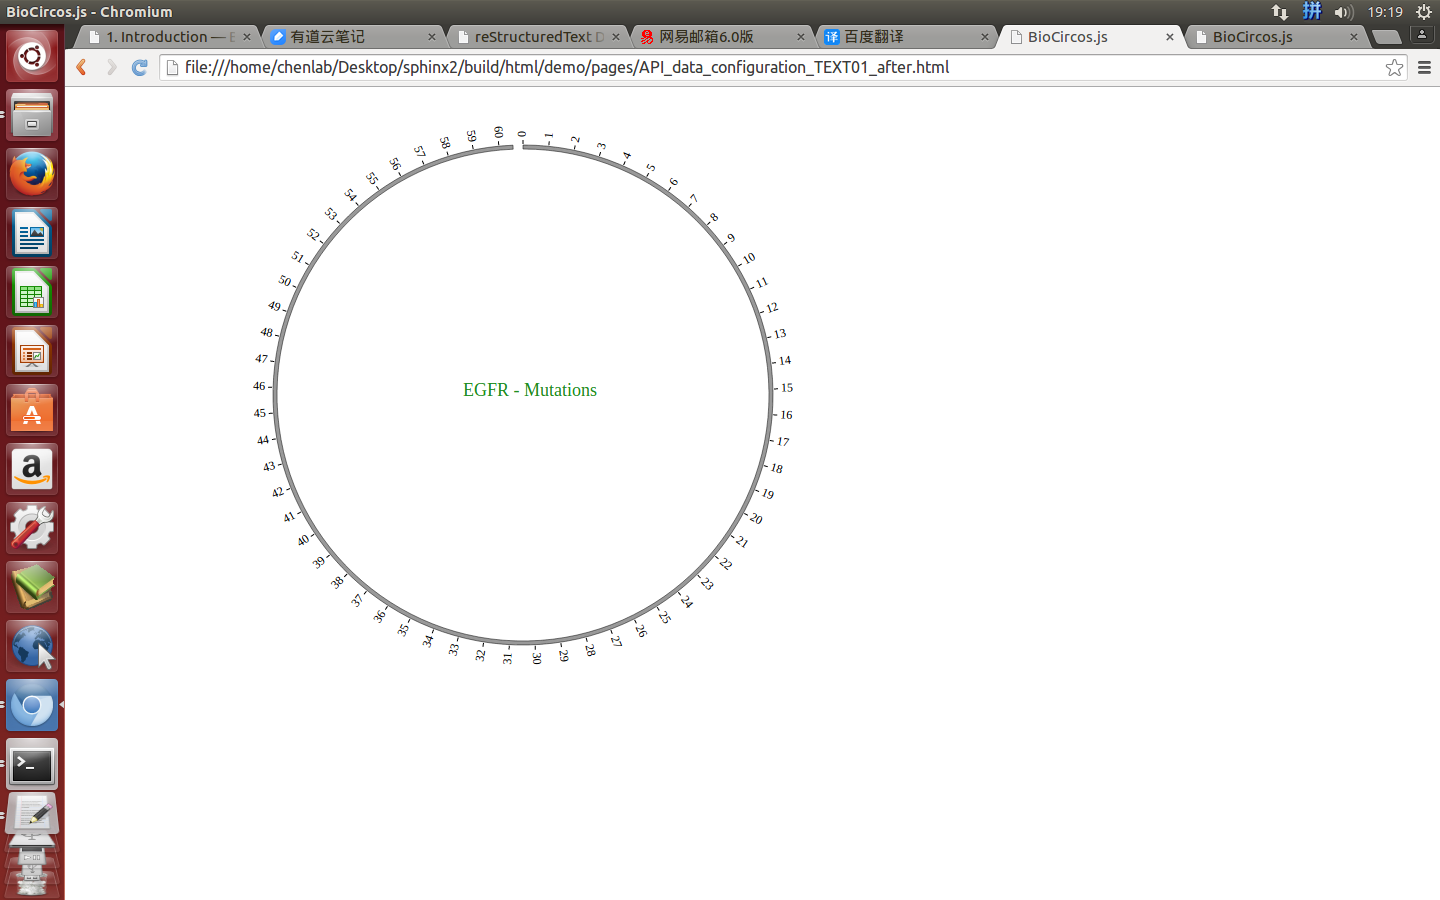
|
7. API: Genome configuration
“Genome configuration” defines the number and size of chromosomes.
Note
“Genome configuration” is especially simple compared to the other two modules. But it is very important for beginners, so here is a special emphasis on how to use it.
7.1 Genome configuration
Genome configuration is set in a <script> tag. Here we configure a genome with 1,2,3,X,Y chromosome.
var BioCircosGenome = [       // Configure your own genome here.
   ["1" , 247249719],
   ["2" , 242951149],
   ["3" , 199501827],
   ["X" , 154913754],
   ["Y" , 57772954]
];
Example: add chromosome
| Example | Before | After |
|---|---|---|
| Code change | var BioCircosGenome = [
["1" , 247249719],
["2" , 242951149],
["3" , 199501827],
["X" , 154913754],
["Y" , 57772954]
];
|
var BioCircosGenome = [
   ["1" , 247249719],
   ["2" , 242951149],
   ["3" , 199501827],
   ["4" , 191154276],
   ["5" , 180915260],
   ["6" , 171115067],
   ["7" , 159138663],
   ["X" , 154913754],
   ["Y" , 57772954]
];
|
| Image change | 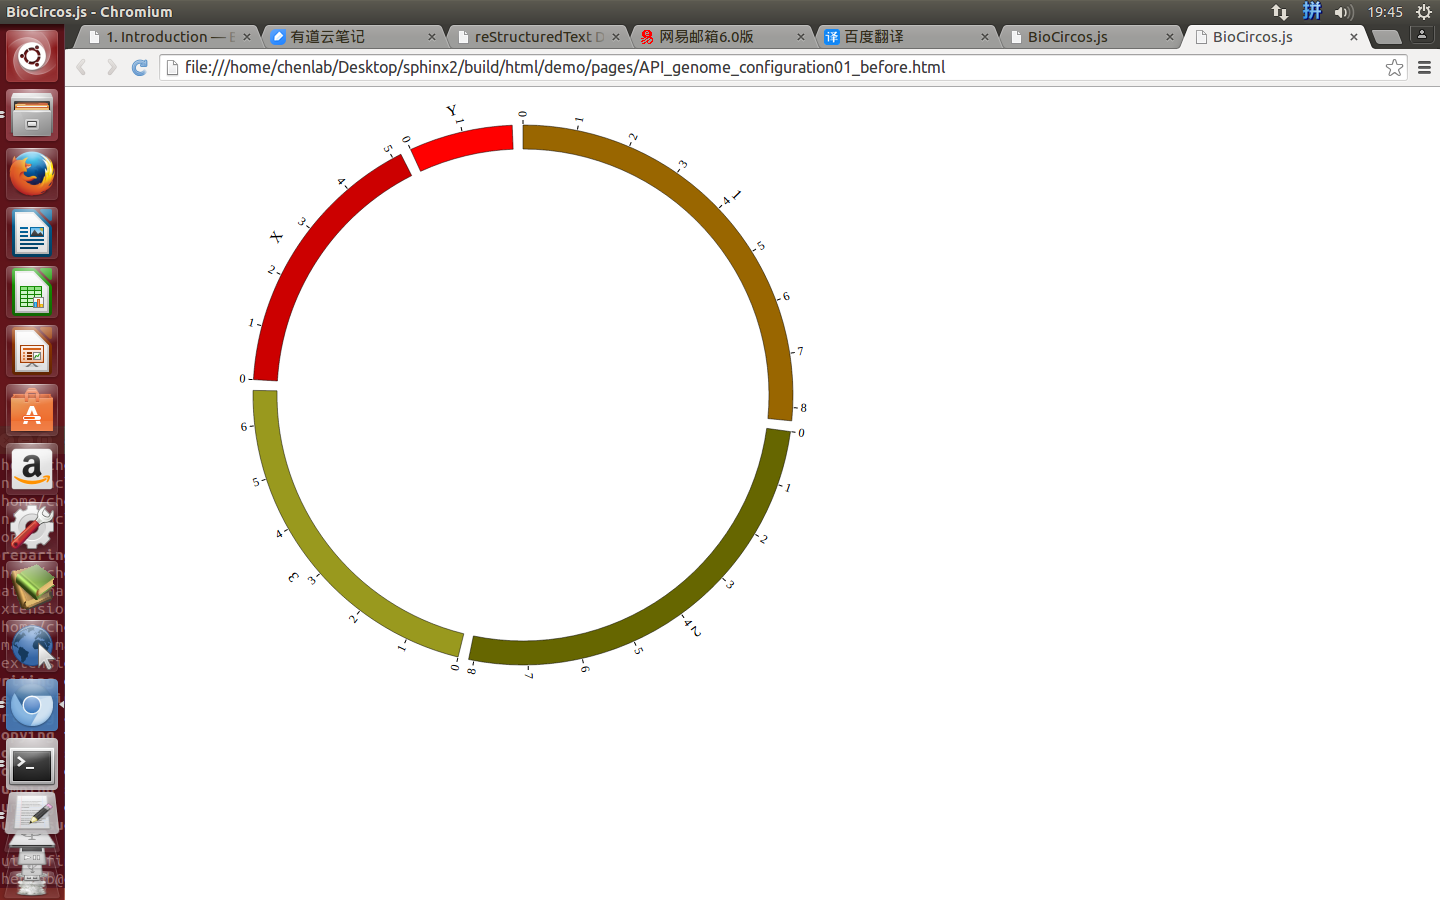
|
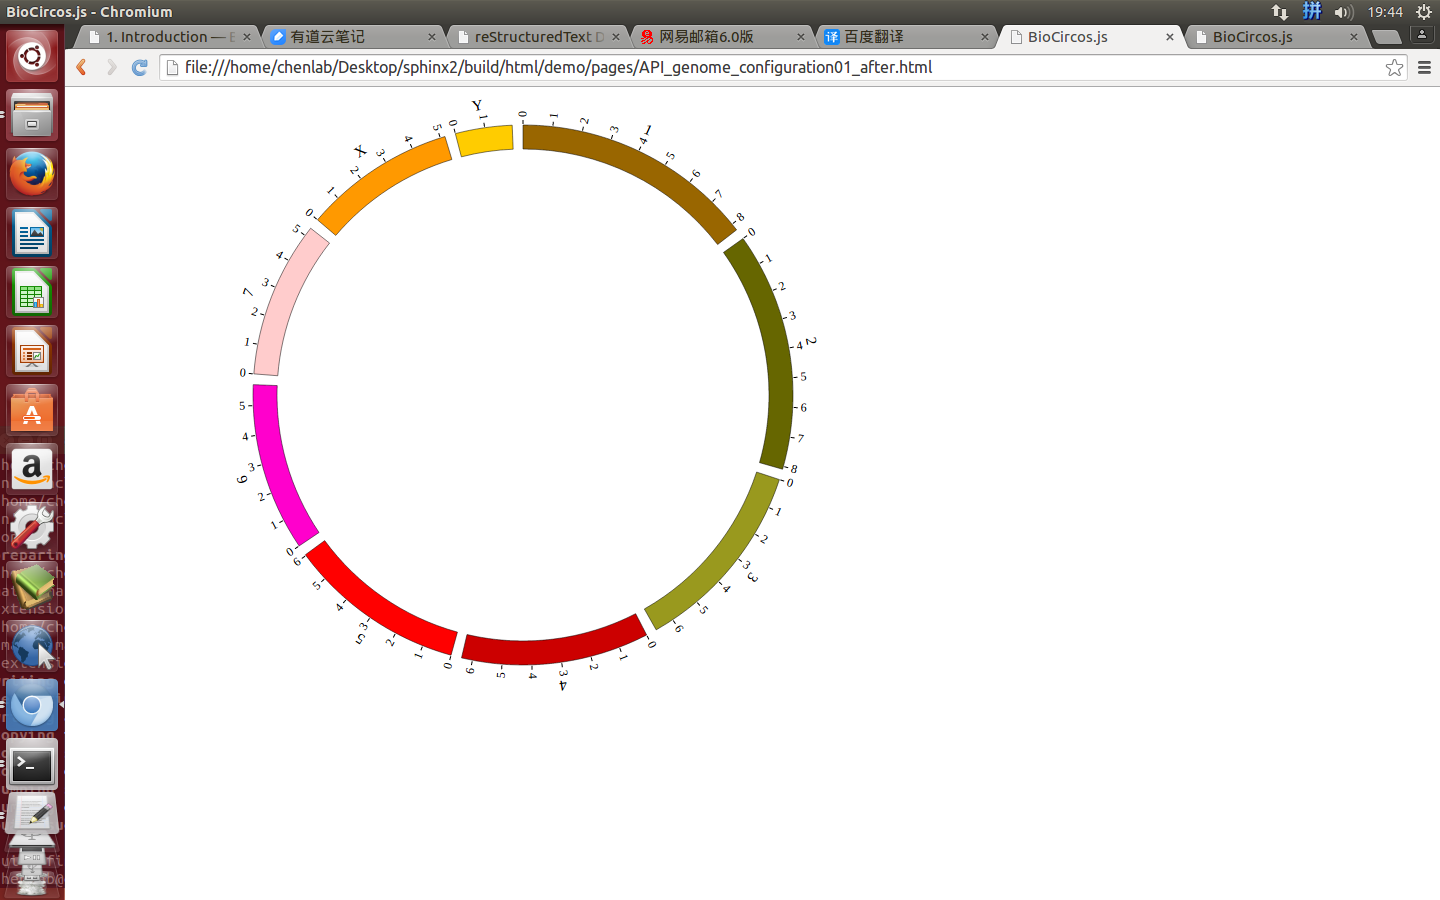
|
7.2 Example: Customize your genome by Main configuration
<script>
  var BioCircosGenome = [      // Configure your own genome here.
     ["1" , 247249719],
     ["2" , 242951149],
     ["3" , 199501827],
     ["X" , 154913754],
     ["Y" , 57772954]
  ];
  BioCircos01 = new BioCircos(BioCircosGenome,{       // Initialize BioCircos.js with "BioCircosGenome" and Main configuration
     target : "example",                              // Main configuration "target"
     svgWidth : 900,                                  // Main configuration "svgWidth"
     svgHeight : 600,                                 // Main configuration "svgHeight"
     innerRadius: 246,                                // Main configuration "innerRadius"
     outerRadius: 250,                                // Main configuration "outerRadius"
     genomeFillColor: ["#999999"]                     // Main configuration "genomeFillColor"
  });
  BioCircos01.draw_genome(BioCircos01.genomeLength);  // BioCircos.js callback
</script>
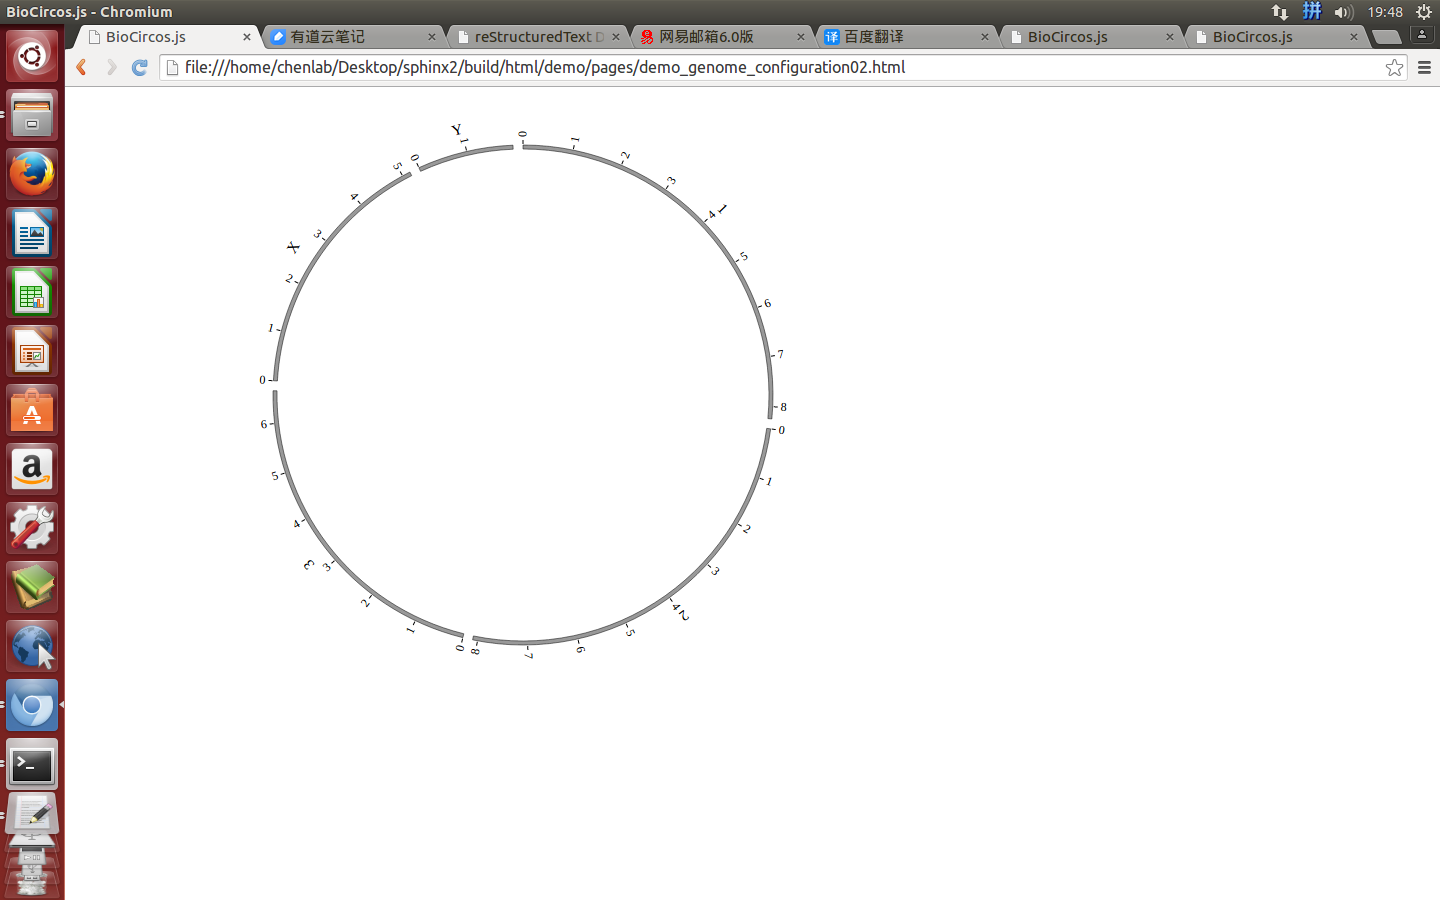
7.3 Example: Human genome (hg19)
<script>
  var BioCircosGenome = [  //human hg19
       ["1" , 249250621],
       ["2" , 243199373],
       ["3" , 198022430],
       ["4" , 191154276],
       ["5" , 180915260],
       ["6" , 171115067],
       ["7" , 159138663],
       ["8" , 146364022],
       ["9" , 141213431],
       ["10" , 135534747],
       ["11" , 135006516],
       ["12" , 133851895],
       ["13" , 115169878],
       ["14" , 107349540],
       ["15" , 102531392],
       ["16" , 90354753],
       ["17" , 81195210],
       ["18" , 78077248],
       ["19" , 59128983],
       ["20" , 63025520],
       ["21" , 48129895],
       ["22" , 51304566],
       ["X" , 155270560],
       ["Y" , 59373566]
  ];
</script>
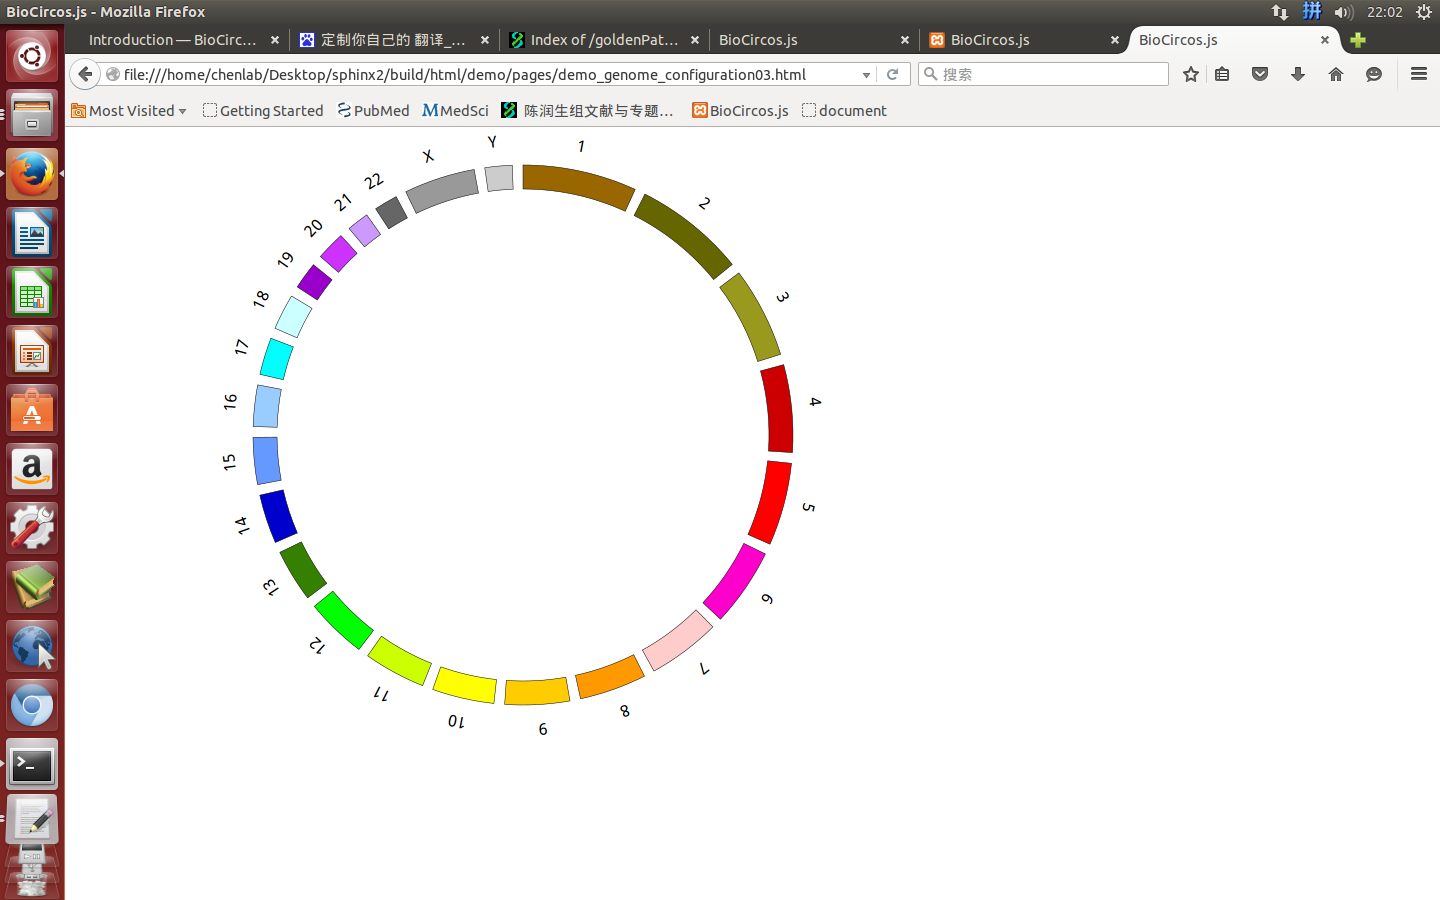
7.4 Example: Add chromosome band on Human genome(hg19)
The chromosome band represents the approximate location of bands seen on Giemsa-stained chromosomes. Color of chromosome band is the as Circos.
| Species | Genome version | Data name | Genome | cytoBand in UCSC |
|---|---|---|---|---|
| Human | grch38 | ARC_grch38 | genome | karyotype.human.grch38.js |
| Human | hg19 | ARC_hg19 | genome | karyotype.human.hg19.js |
| human | hg18 | ARC_hg18 | genome | karyotype.human.hg18.js |
| Mouse | mm10 | ARC_mm10 | genome | karyotype.mouse.mm10.js |
| Mouse | mm9 | ARC_mm9 | genome | karyotype.mouse.mm9.js |
<script src="../data/karyotype.human.hg19.js"></script>
<script>
  var BioCircosGenome = [  //human hg19
       ["1" , 249250621],
       ["2" , 243199373],
       ["3" , 198022430],
       ["4" , 191154276],
       ["5" , 180915260],
       ["6" , 171115067],
       ["7" , 159138663],
       ["8" , 146364022],
       ["9" , 141213431],
       ["10" , 135534747],
       ["11" , 135006516],
       ["12" , 133851895],
       ["13" , 115169878],
       ["14" , 107349540],
       ["15" , 102531392],
       ["16" , 90354753],
       ["17" , 81195210],
       ["18" , 78077248],
       ["19" , 59128983],
       ["20" , 63025520],
       ["21" , 48129895],
       ["22" , 51304566],
       ["X" , 155270560],
       ["Y" , 59373566]
  ];
</script>